Your Core Model Isn't Supposed to Do Everything | Power BI Extensibility Layer Objects

Video by: Reid Havens

Here's something that trips up a lot of Power BI developers: not everything belongs in your core semantic model. Some objects are meant to live in a departmental layer. Some belong in a single report, knowing the difference changes how you build, and how well your architecture holds up over time.

In this video I walk through Power BI's extensibility layer objects: what they are, where each one belongs in your architecture, and when to actually use them.

RELATED CONTENT 🔗

Full Guide | Analytic Endeavors

Power BI Report-Scoped Measures: 6 Patterns for Better Reports

Video by: Reid Havens

Report-scoped measures (aka report-specific measures) are one of the easiest ways to level up a Power BI report without turning your semantic model into a junk drawer.

In this video, I walk through my Visual & Report-Scoped Measures guide and show the art of the possible. No deep DAX theory, no data engineering detours, just practical patterns you can steal immediately.

We’ll cover:

  • What “report-scoped” measures are (and when you should use them)

  • Six practical patterns for enhancing report UX with measures

  • Dynamic titles that respond to context

  • Conditional formatting driven by measures (so visuals explain themselves)

  • How to keep your model clean while still making reports more interactive and readable

If you build reports for humans (not just for your own amusement), this is a strong set of patterns to have in your toolkit.

Power BI Field Parameters vs Calculation Groups (Clear Comparison)

Video by: Reid Havens

In this video I walk through the Field Parameters vs Calculation Groups Guide from Analytic Endeavors and explain what these two powerful Power BI features actually do, how they differ, and when to use each one in your reports.

You’ll learn:

  • What Field Parameters are and how they let your users choose what to show in visuals

  • What Calculation Groups are and how they let you change how measures calculate dynamically

  • The key decision points between using FP and CG

  • How each feature affects report design, maintenance, and flexibility

This is a conceptual walkthrough, not a step-by-step build. The goal is to help you understand the behaviors and tradeoffs so you can pick the right tool for the problem you’re solving.

Vibe Coding a Desktop Tool with AI

Video by: Reid Havens

This project was built almost entirely using Claude Code through pure vibe coding. No detailed specs.

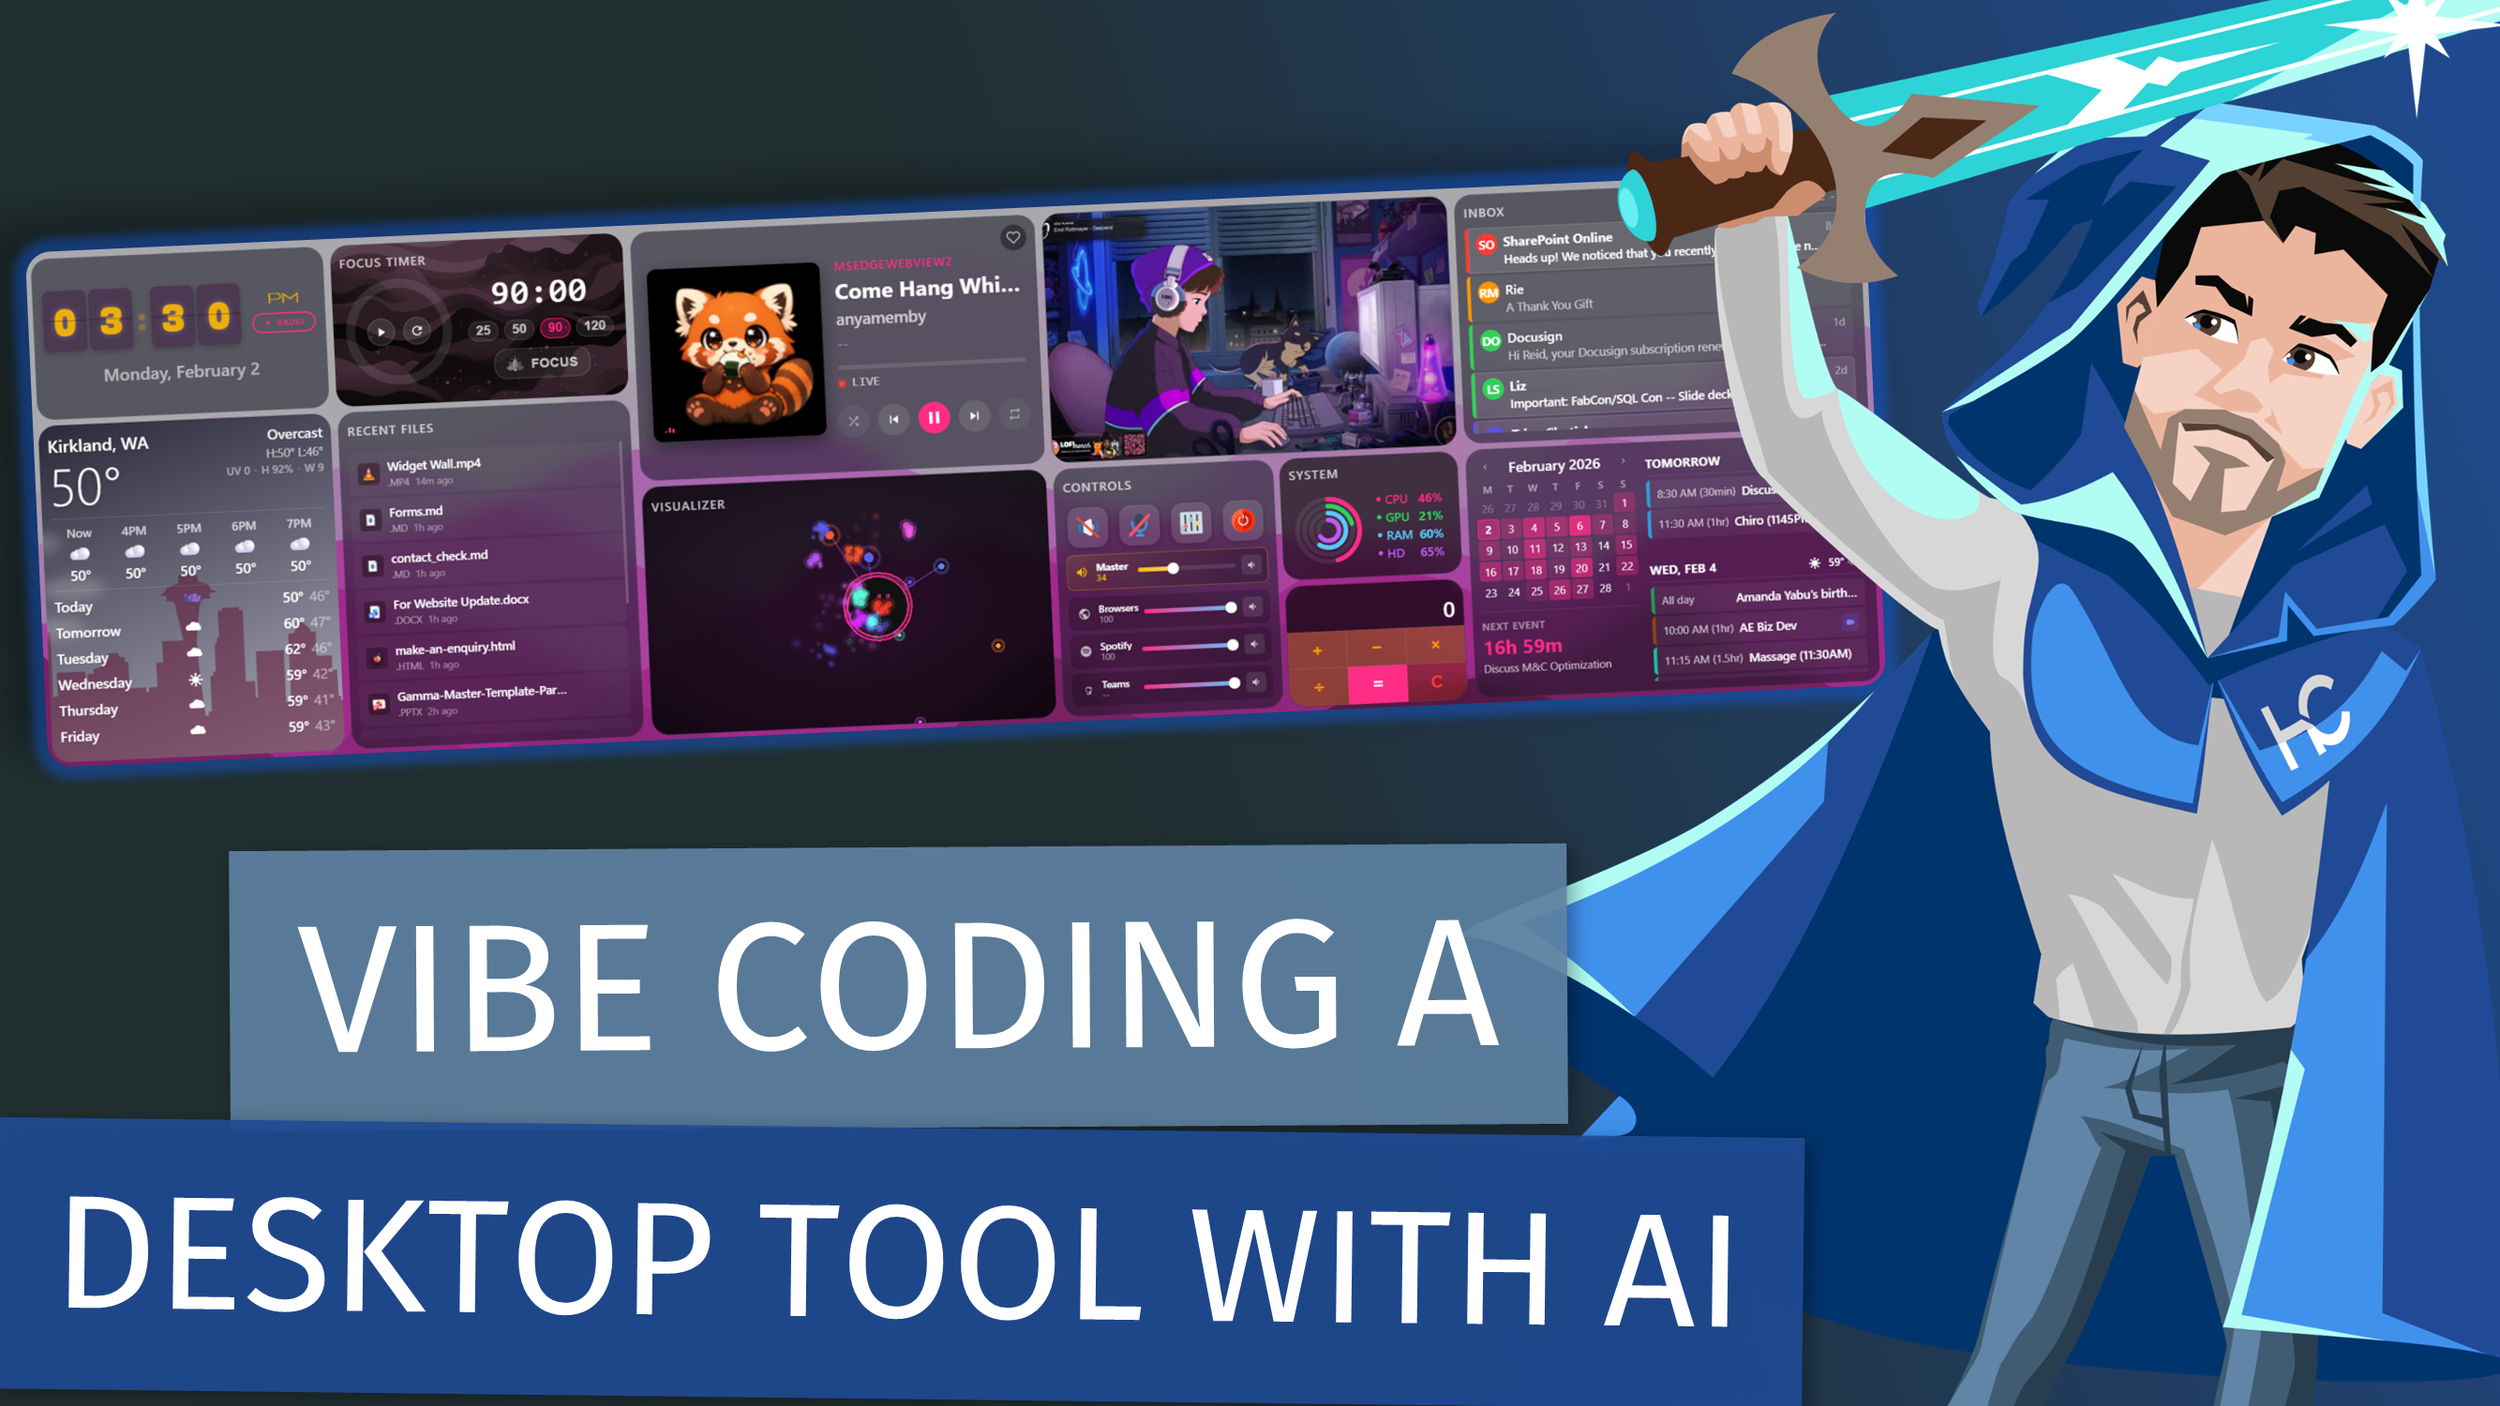
No formal architecture. Just me giving the LLM ideas, screenshots, and plain-English requests until a real desktop tool existed. In this video, I walk through the Desktop Widget Wall I built and focus on the art of the possible, not the implementation details. This is a non-technical walkthrough meant to show how far you can go when you treat an LLM like a creative collaborator instead of a code generator.

You’ll see how:

  • An idea turns into a working desktop tool

  • Screenshots and rough concepts become real UI

  • AI can iterate on structure, layout, and behavior - “Vibe coding” can replace traditional dev workflows for small tools

  • You can prototype software without writing much code yourself This isn’t a tutorial and it’s not a “how to prompt” video.

It’s a real example of what happens when you lean into AI-assisted building and let the tool do the heavy lifting. If you’re curious about rapid prototyping, personal tooling, or what modern LLMs can actually build, this should give you plenty of ideas.

RELATED CONTENT 🔗

Widget Wall Repo

Posted on February 24, 2026 and filed under Topics & Discussion, AI.