(Livestream Replay) How to Aggregate Large Datasets in Power BI - with Tristan Malherbe

In this session, Tristan Malherbe (Microsoft Data Platform MVP) will show you how you can leverage Power BI aggregations to analyze big volumes of data in Power BI. Tristan will illustrate the power of Aggregations with the famous New York City Taxi dataset.

GUEST BIO πŸ‘€

Tristan Malherbe is the Founder of Data Pulse and a Microsoft Data Platform MVP since 2017. He is also the co-founder and current co-leader of the French Power BI User Group in France (Club Power BI). His favorite topics are: advanced data modelling, DAX, Data Visualization & performance tuning.

RELATED CONTENT πŸ”—

Tristan's LinkedIn
Tristan's Twitter
Tristan's YouTube

Posted on November 2, 2021 and filed under Livestreams, Data Modeling.

Adding Custom (SVG) Icon Hover Effects in a Single Button!

Video by: Reid Havens

With the addition of new button features and formatting options you can now implement custom (SVG) icons inside of a single button! Plus the custom icon can be unique for each button state (default, hover, and press), allowing for so many options to customize and design your buttons.

RELATED CONTENT πŸ”—

How to Power BI Button Effects

Download Report From The Blog Files Page

(Livestream Replay) The Skills Your Power BI Team Needs to Succeed - with Ed Hansberry

What does it mean to implement Power BI in your organization? Who is on the Power BI Team, and what skills do they need? This goes beyond report authoring. It is an organizational initiative!

GUEST BIO πŸ‘€

My background is as a CPA and have spent most of my career in financial and accounting related positions. I am an experienced Controller with a demonstrated history of working in the consumer goods industry. Skilled in Budgeting, Operations Management, Consumer Products, Business Development, and Strategic Planning. I have a Microsoft Certification using Power BI (MCSA BI Reporting), and am technically proficient with in Microsoft Power BI tools using Data Analysis Expressions (DAX), data modeling, Power Query/M Language, Power Pivot, DAX Studio, and Microsoft Excel. Strong accounting professional with a Bachelor of Arts (B.A.) focused in Accounting and Business/Management from Lipscomb University.

RELATED CONTENT πŸ”—

Ed's Blog
Ed's LinkedIn
Ed's Twitter

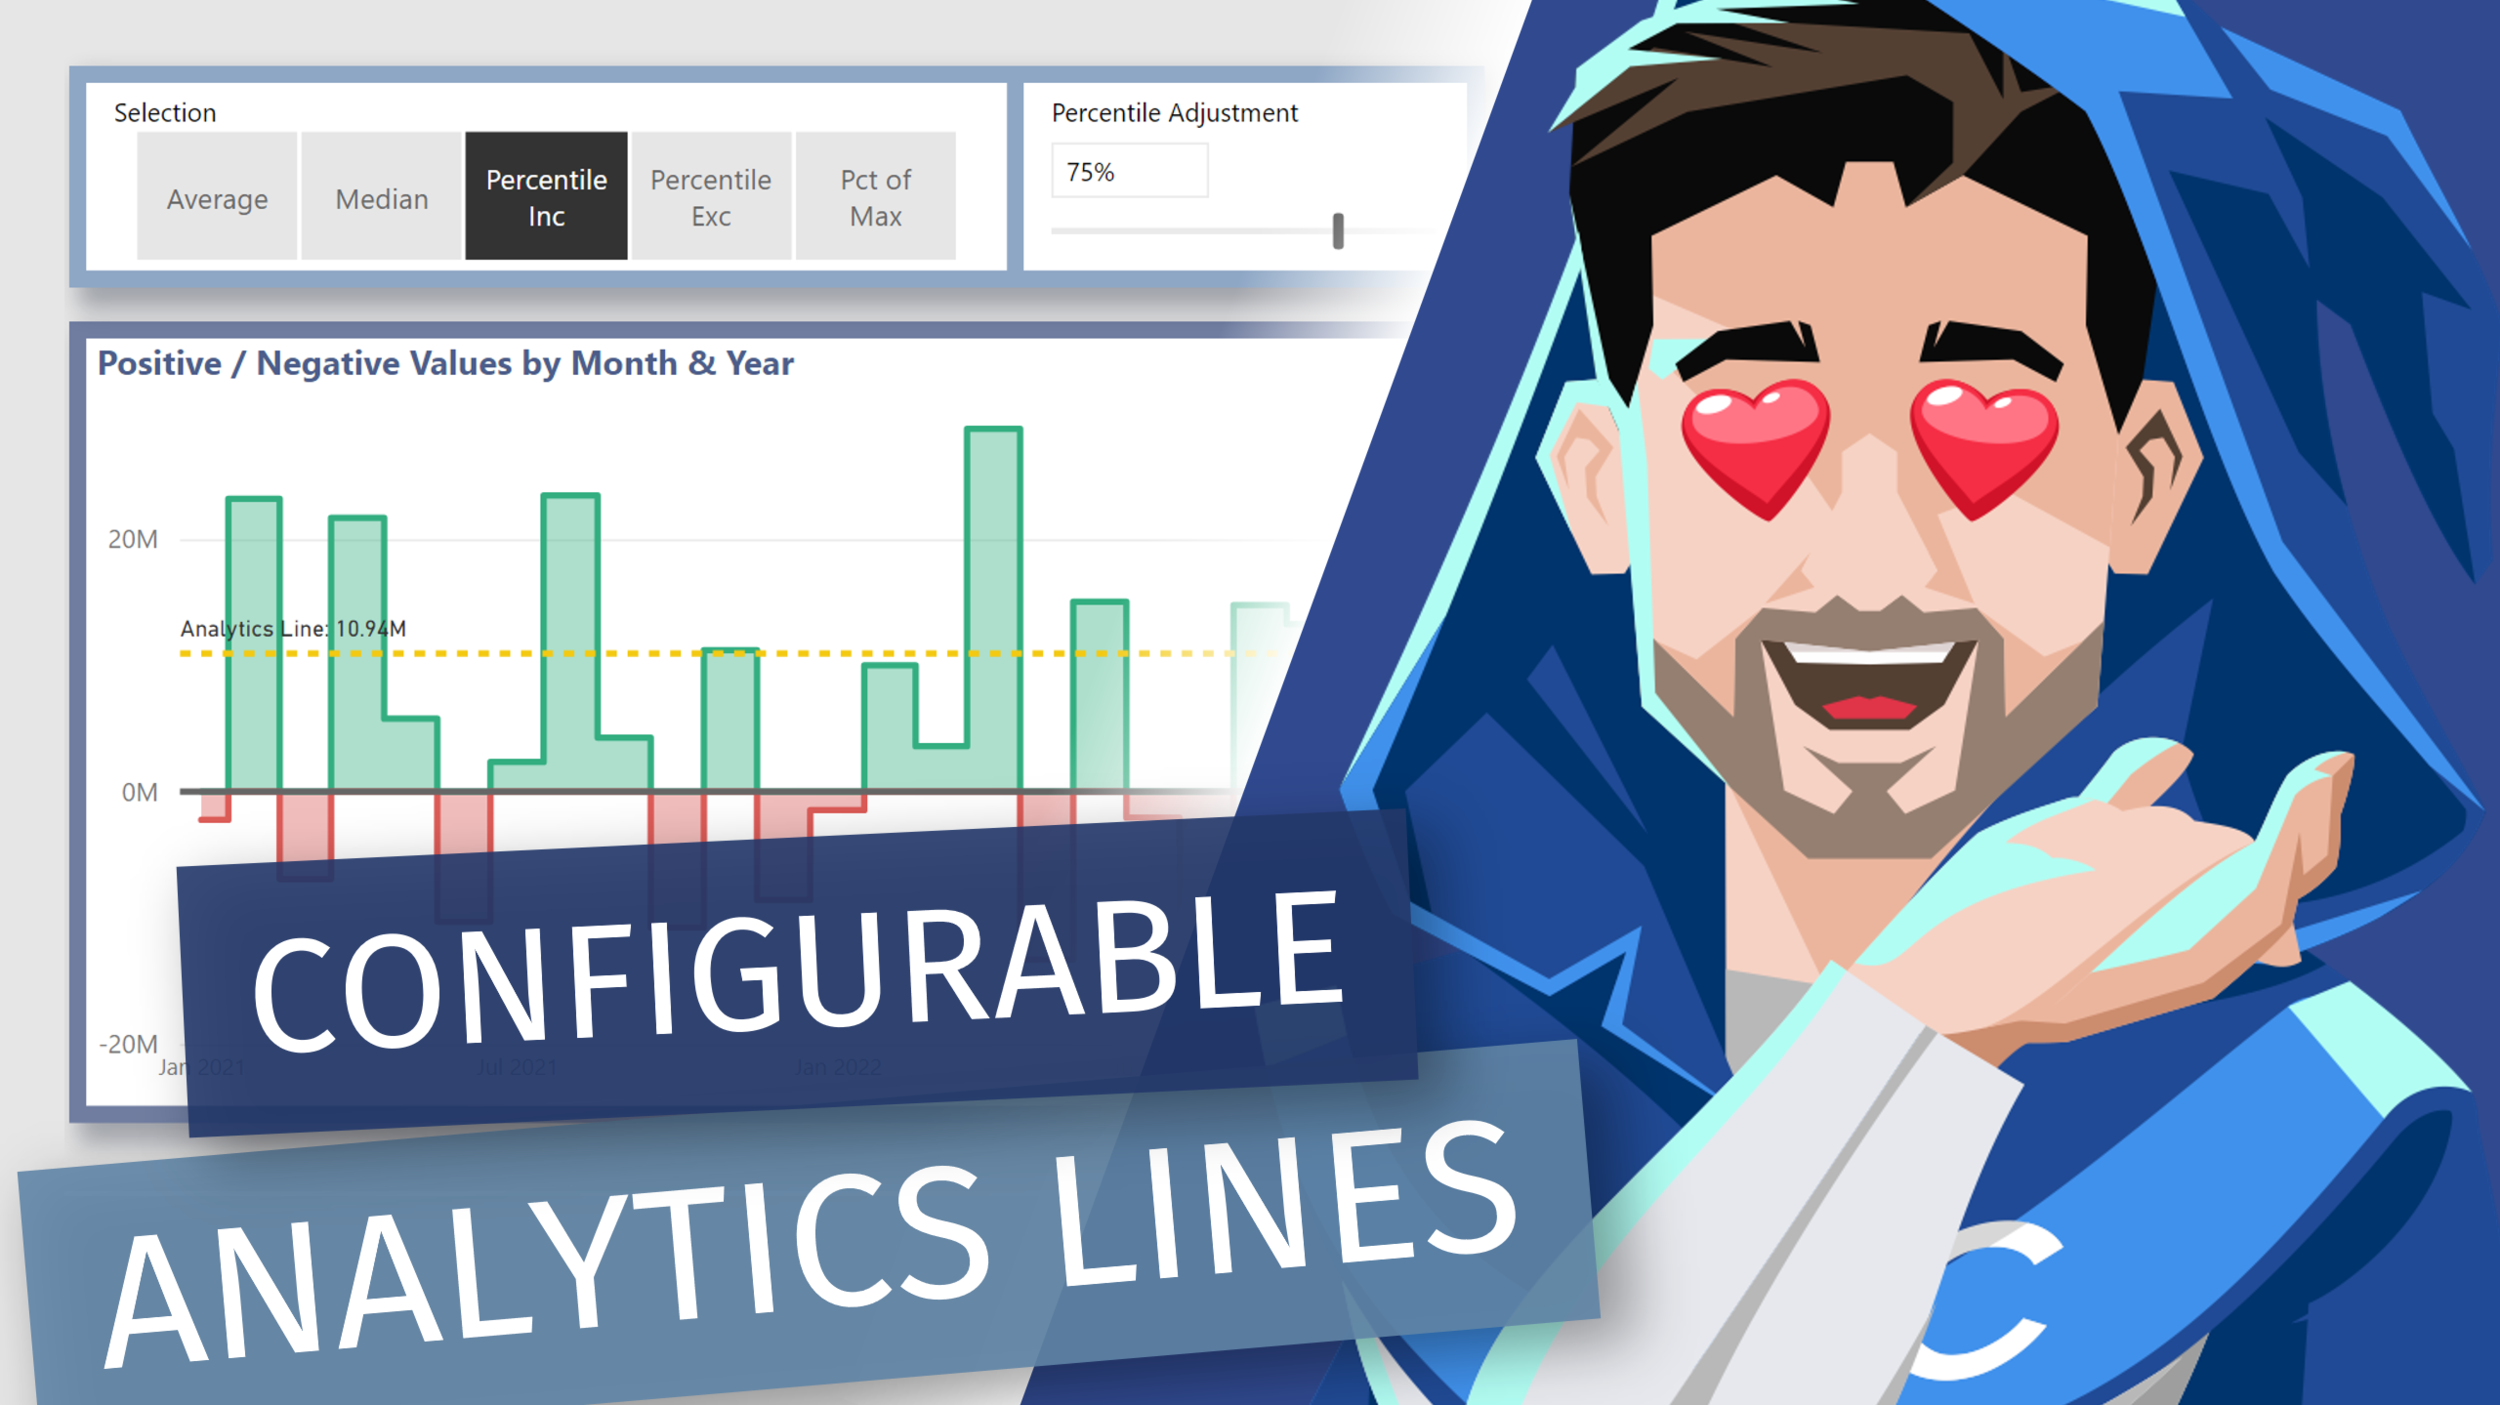
Adding Dynamic [DAX] Analytics Lines to Native Visuals in Power BI

Video by: Reid Havens

Learn how to add [DAX] measure driven values the y-axis constant lines. Allow us to essentially recreate multiple analytics lines that can be configurable by user slicer selections in Power BI.

RELATED CONTENT πŸ”—

Positive/Negative Line Colors

Download Report From The Blog Files Page