Posts filed under Visualizations

IMPROVED Dynamic [DAX] Analytics Lines in Power BI

Video by: Reid Havens

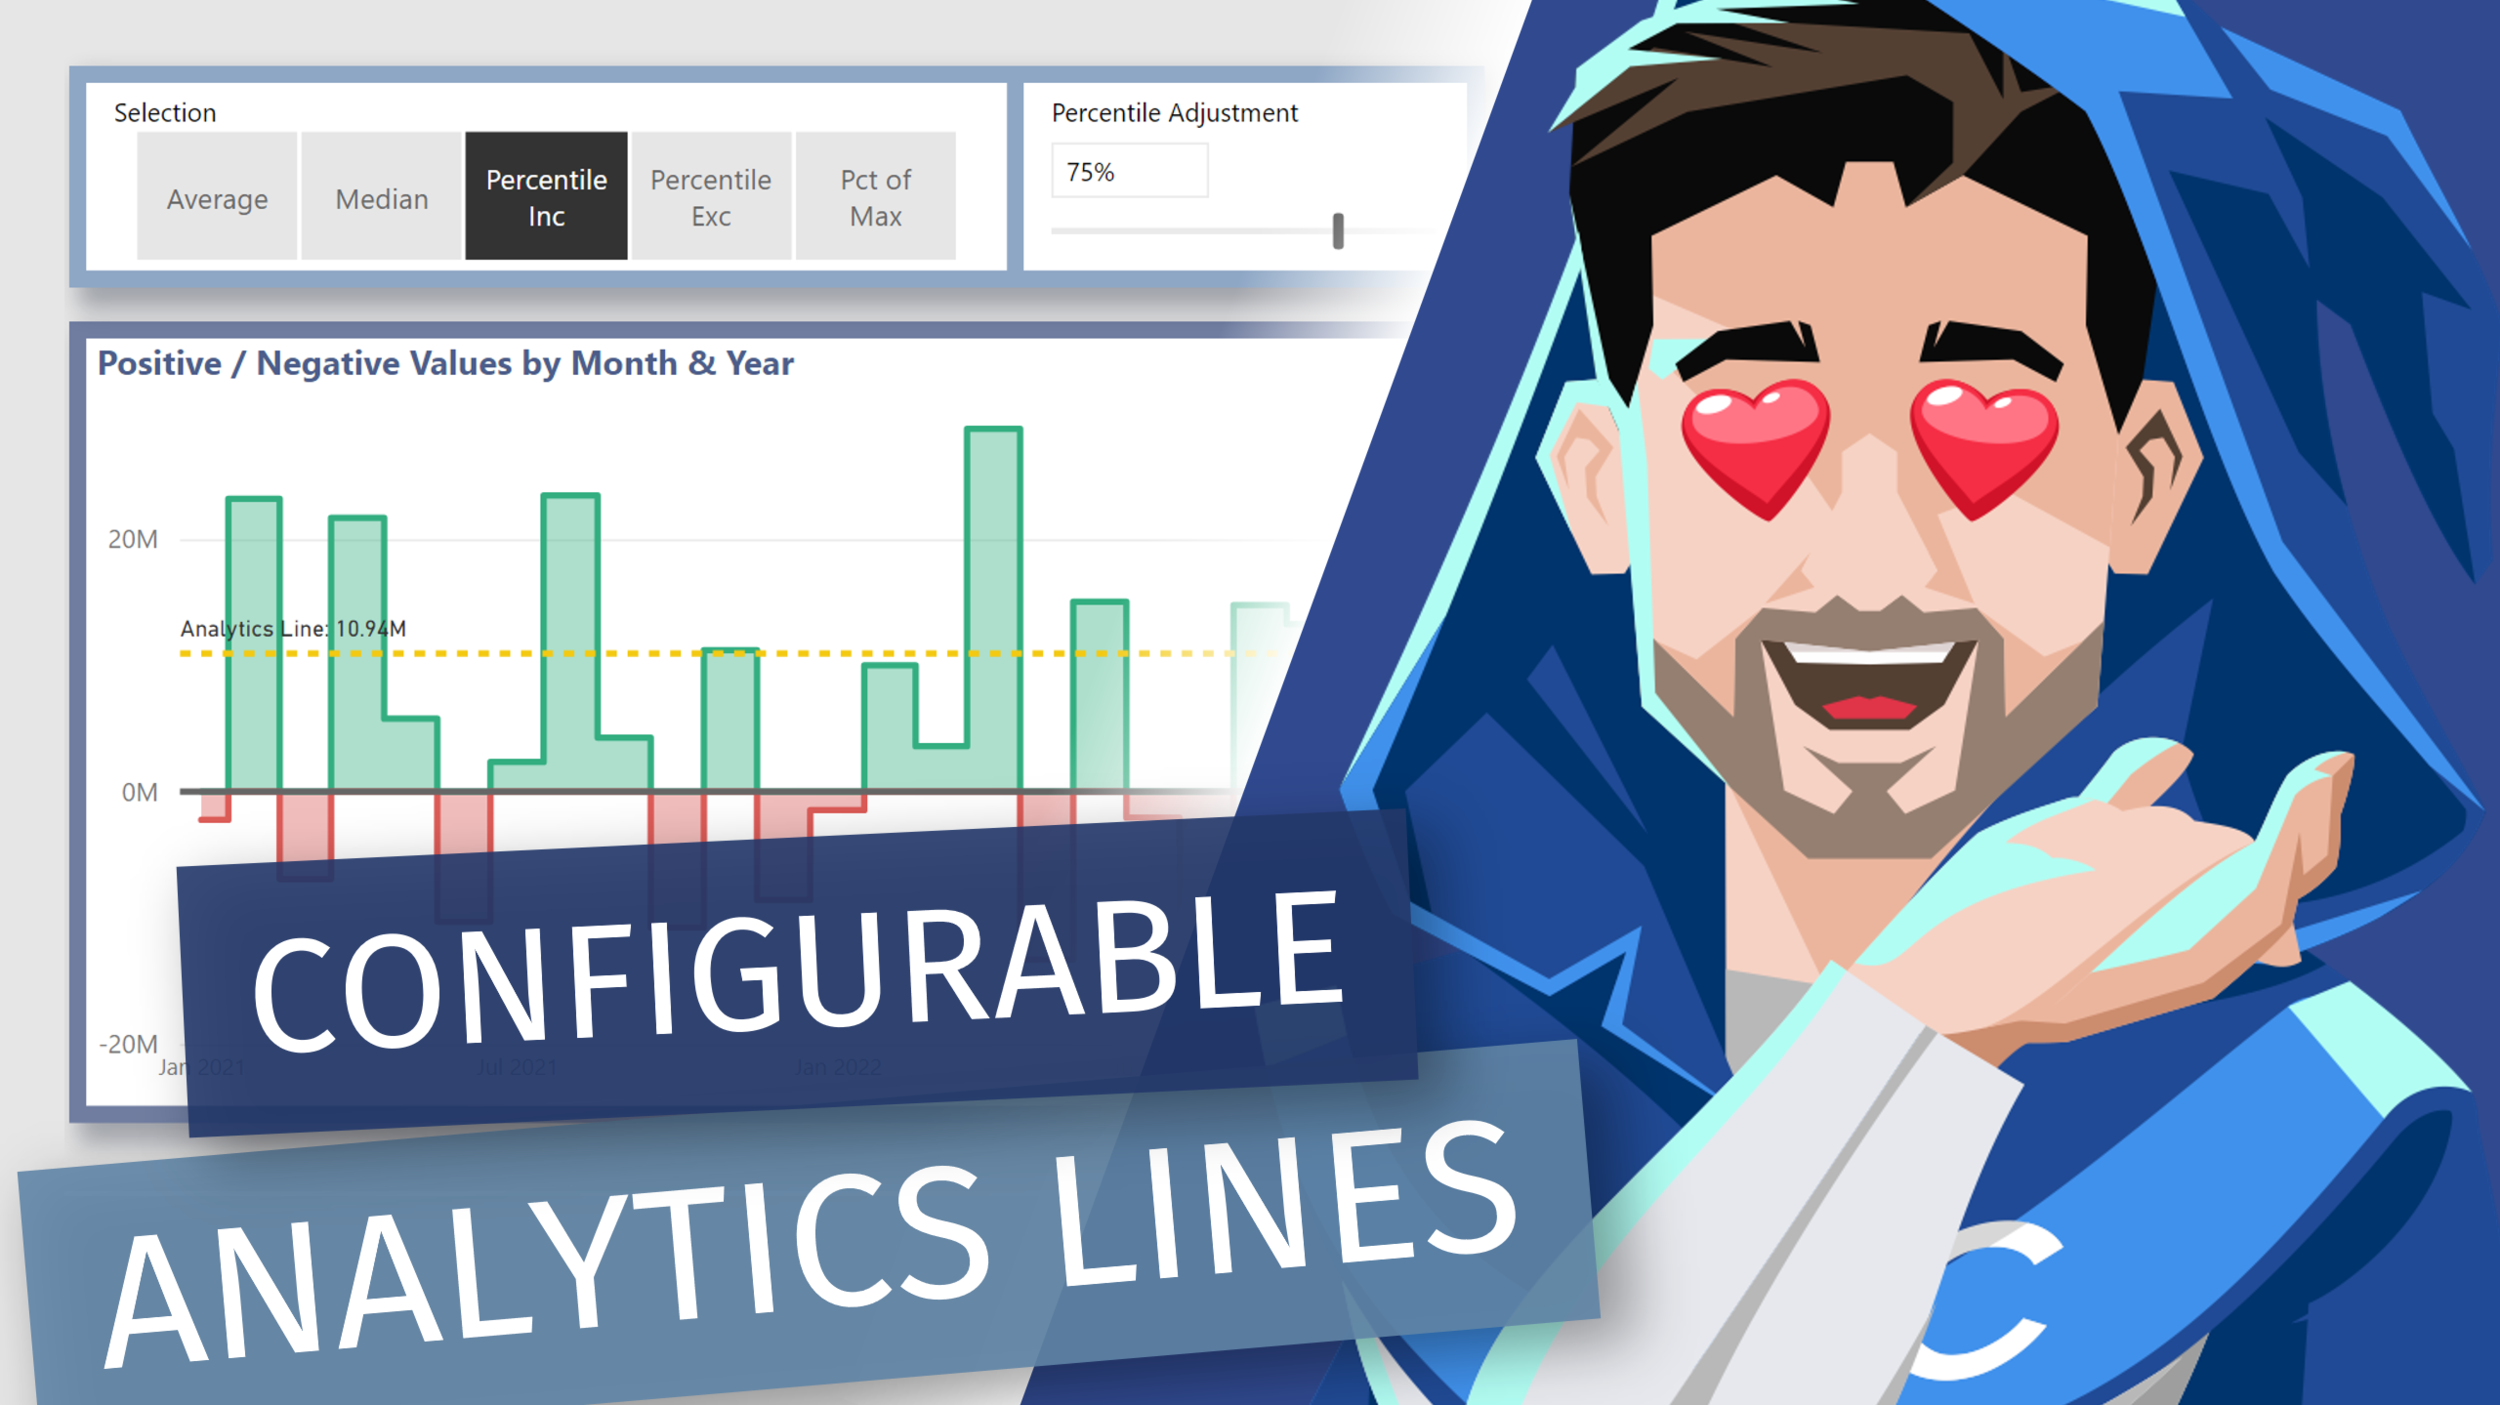
Learn how to prevent a [DAX] error message when setting the Percentile percentage for the Dynamics Analytics Line I showcased back in October.

RELATED CONTENT 🔗

Dynamic [DAX] Analytics Line
DAX Guide - PERTENTILE.EXC
DAX Guide - PERTENTILE.INC

Dynamic Font Color Logic with Conditional Formatting in Power BI

Video by: Reid Havens

Learn how to add additional Conditional Formatting logic to font colors when used together with dark background colors or data bars on the table or matrix native visuals in Power BI.

Posted on December 7, 2021 and filed under Power BI, Visualizations, Beginner.

Adding Custom (SVG) Icon Hover Effects in a Single Button!

Video by: Reid Havens

With the addition of new button features and formatting options you can now implement custom (SVG) icons inside of a single button! Plus the custom icon can be unique for each button state (default, hover, and press), allowing for so many options to customize and design your buttons.

RELATED CONTENT 🔗

How to Power BI Button Effects

Adding Dynamic [DAX] Analytics Lines to Native Visuals in Power BI

Video by: Reid Havens

Learn how to add [DAX] measure driven values the y-axis constant lines. Allow us to essentially recreate multiple analytics lines that can be configurable by user slicer selections in Power BI.

RELATED CONTENT 🔗

Positive/Negative Line Colors