
Video by: Reid Havens
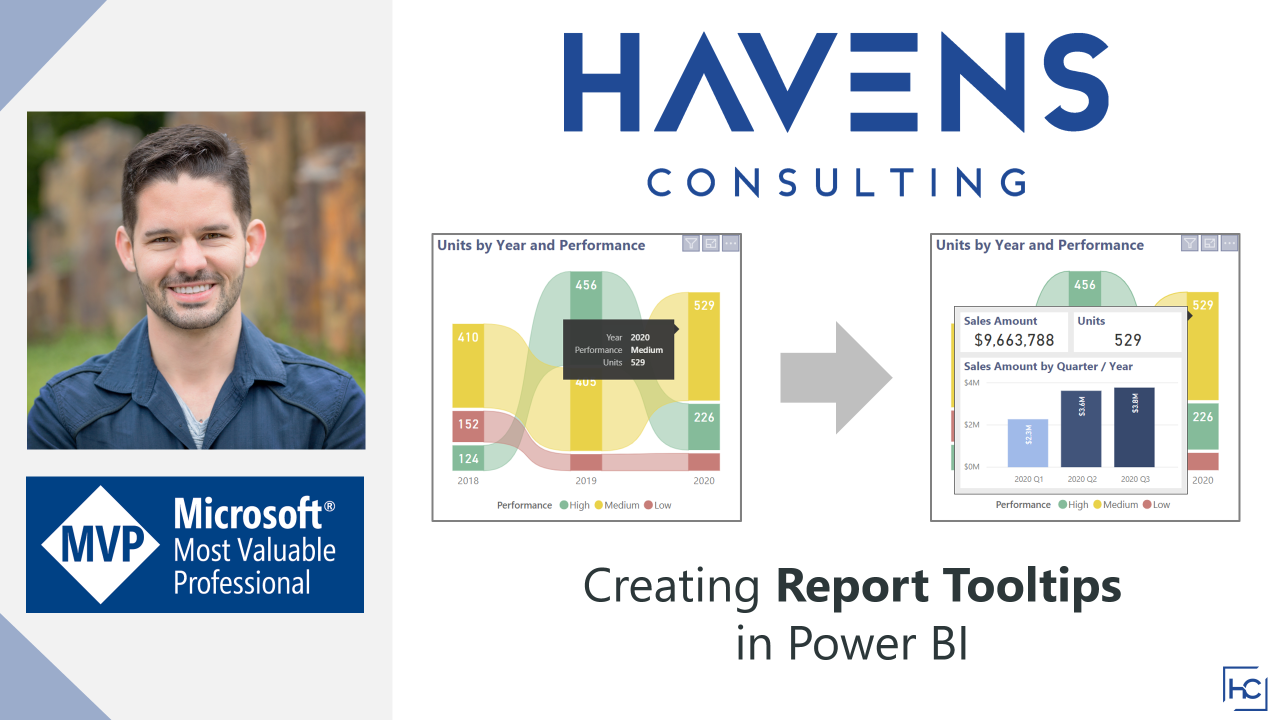
Learn how to create report page tooltips within Power BI reports. Also get access to multiple tooltip page templates to fit most sizes and needs.
 Havens Consulting
Video by: Reid Havens
Learn how to create report page tooltips within Power BI reports. Also get access to multiple tooltip page templates to fit most sizes and needs.
Video by: Reid Havens
Learn how to leverage bookmarks in Power BI to change the font size of visualizations and objects in Power BI Reports.
Video by: Reid Havens
Given how much fun I had making the SVG sparklines in last weeks video. I thought I'd explore what other things I could do with the image rendering ability inside of Power BI tables. In this video you'll see that you can also render full SVG images, as well as animated GIFS using DAX.
SVG image converter I used to create the zelda hearts: Link
GIF creator I used to create the animated doom guy face: Link
Video by: Reid Havens
With the recent update that allows tables in Power BI to render SVG images. We can now create interactive charts and sparklines directly inside of the tables. Learn how to leverage DAX to create well designed sparklines in this video.

Signup for our mailing list to gain access to Power BI files and templates from the videos. You’ll receive a welcome email with a link and password to the Blog Files page.
Reid Havens’ early love affair with analytics has, over the past decade, turned into an evolution into data visualization and report design in Power BI.
Since then Reid has been writing articles and creating YouTube videos to share the word of BI, helping to inspire the next generation of Business Intelligence enthusiasts.


