Posts filed under DAX

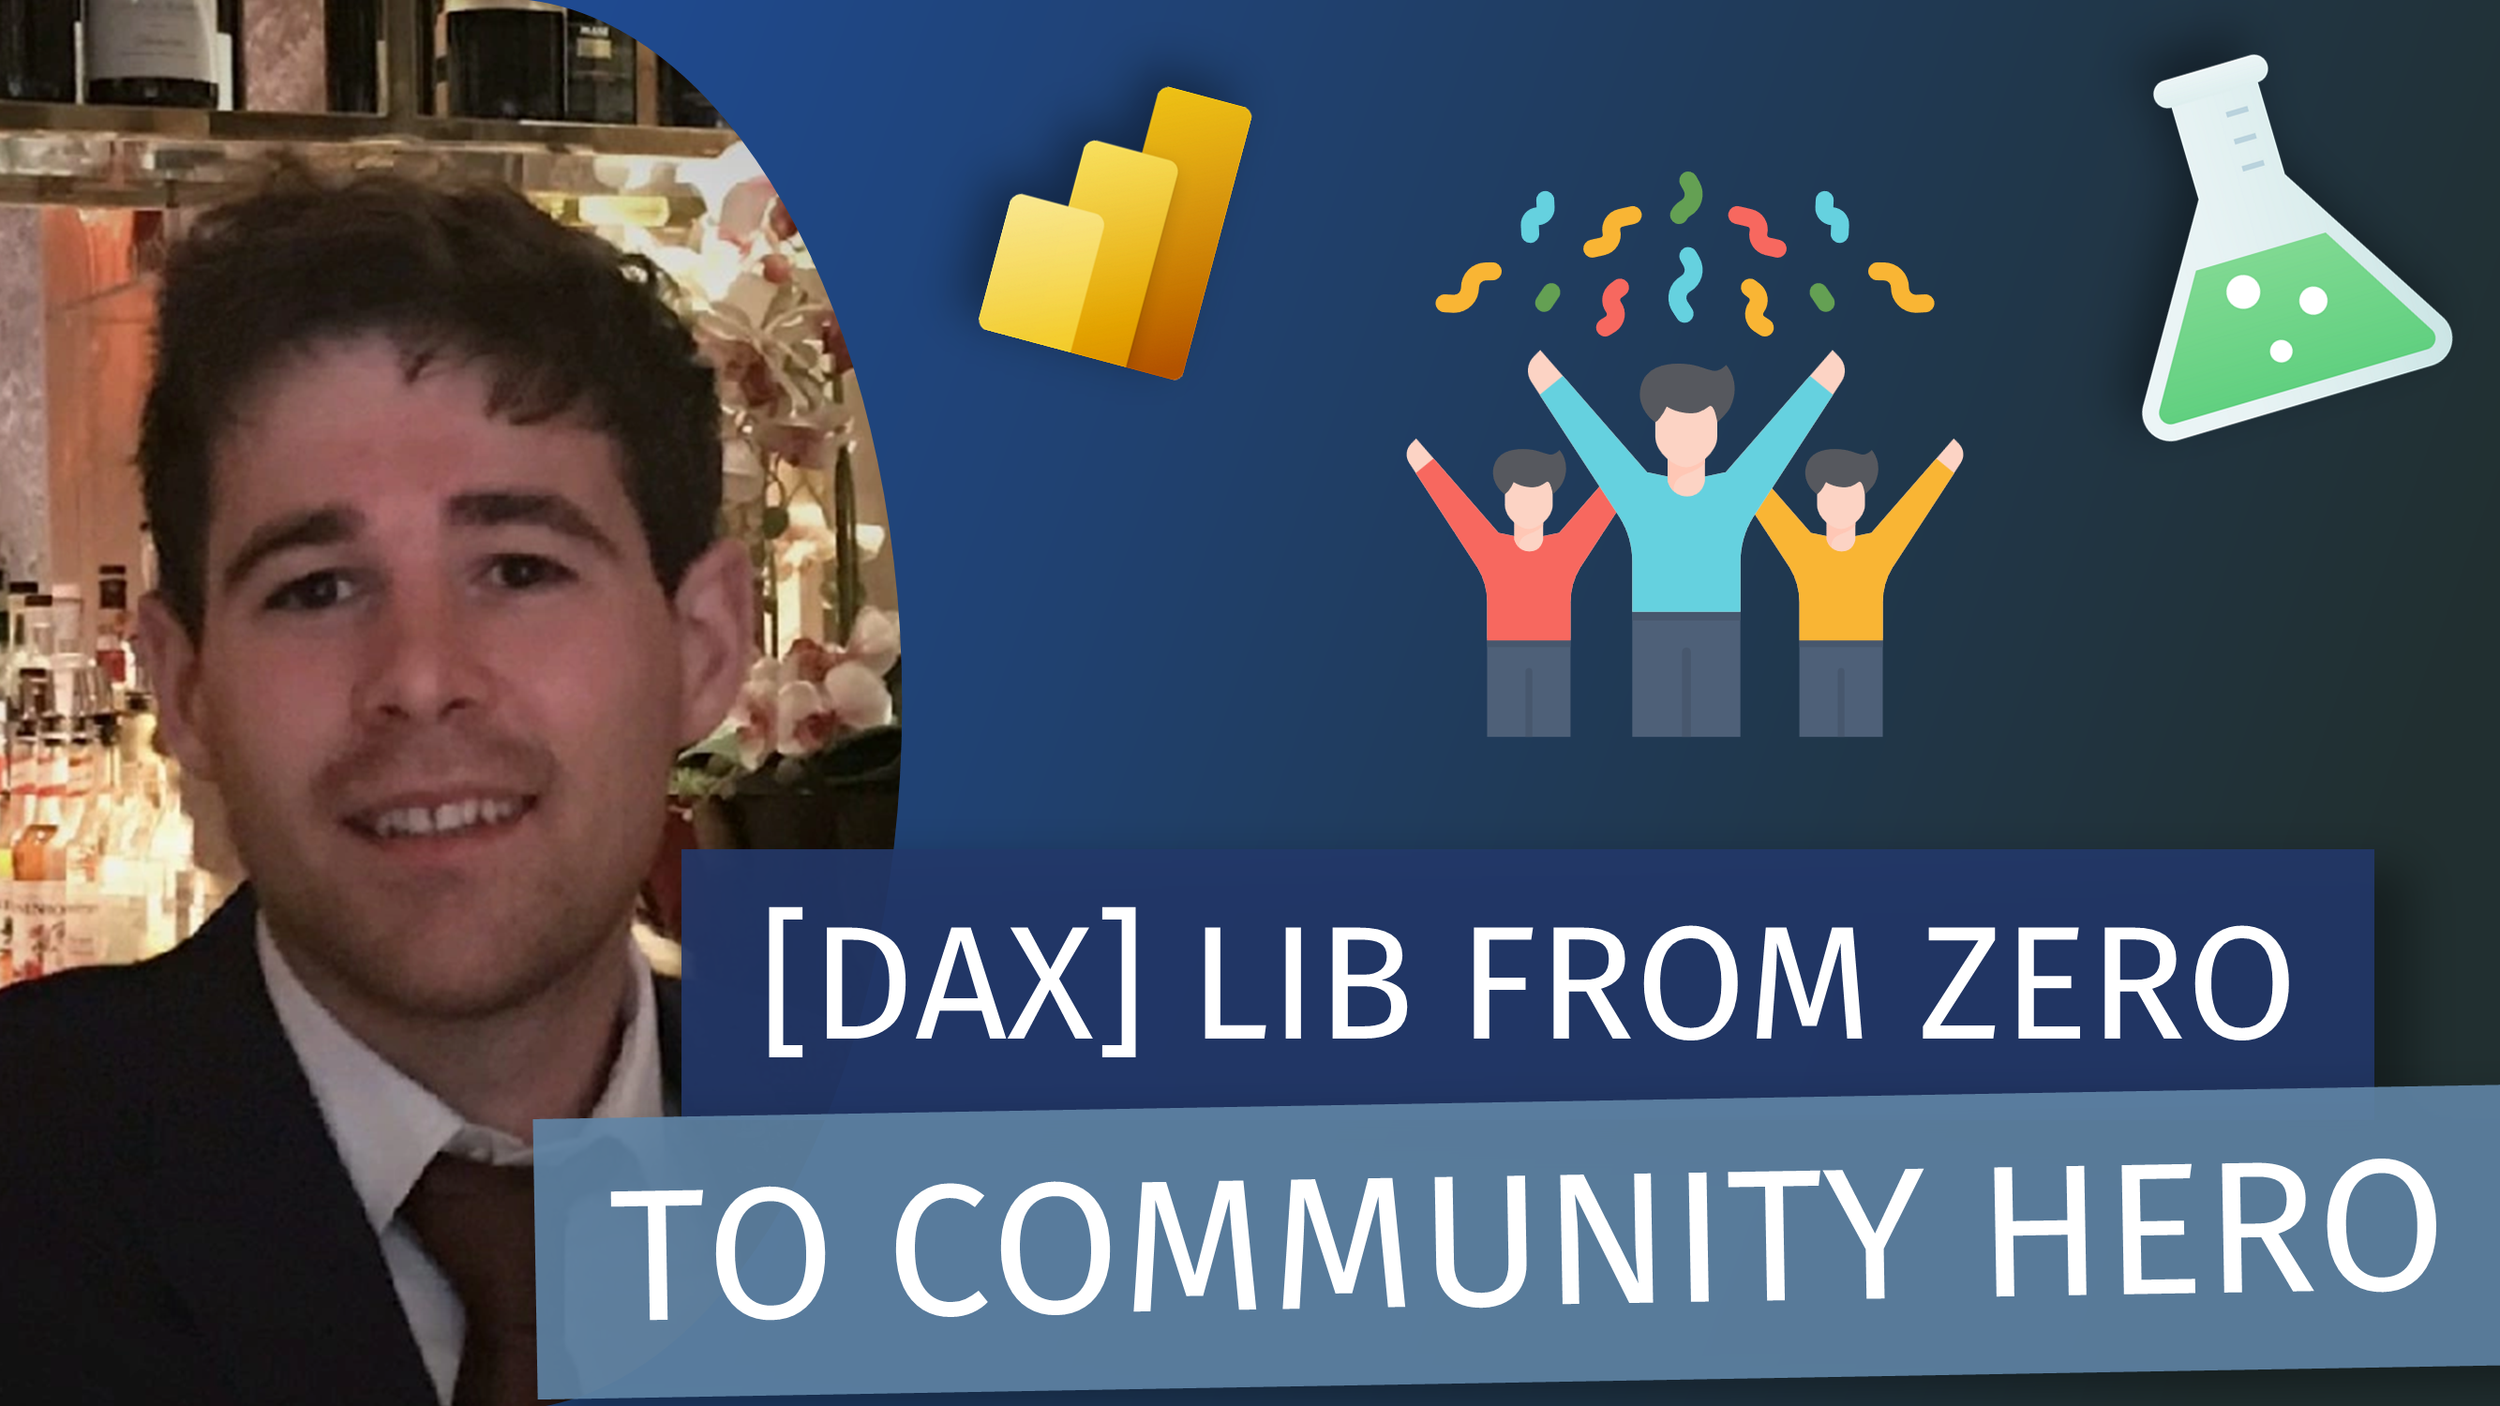
[DAX] Lib - From Zero to Community Hero (with Jake Duddy)

LIVESTREAM DATE/TIME 📅

MAY 15TH 2026 (Pacific Time)

DESCRIPTION 📄

User-defined functions landed in DAX last September, and SQLBI launched DAXLib alongside them as a community repo for sharing libraries. There are already 30+ packages people can pull straight into their models. If you've built a UDF that made your own life easier, odds are someone else is working around the same problem.

This stream is about closing that gap. Jake Duddy joins me to walk through what it actually takes to turn a working UDF into a published DAXLib package that other people can install and use. Jake recently contributed EvaluationContext.Colour (a HEX manipulation library for SVG and conditional formatting work), so he's been through the workflow recently and has the bruises to show for it.

What we'll cover:

  • DAXLib: what it is and why SQLBI built it

  • Model-independent vs model-dependent functions, and which belong in a library

  • Packaging a UDF for publication

  • Submitting through GitHub

  • What separates a useful contribution from noise

  • Q&A throughout

GUEST BIO (Jake Duddy)👤

Jake Duddy is a Microsoft Data Platform MVP and Power BI SME based in Birmingham, UK. He runs the Evaluation Context blog covering Power BI, Fabric, DAX, and SSAS, and speaks regularly at SQLBits, the Power BI & Fabric Summit, and the Microsoft Data Platform Group Birmingham. Links to DAXLib, Jake's blog, and his EvaluationContext.Colour library are in the comments. #PowerBI #DAX #MicrosoftFabric #DAXLib #UDF
RELATED CONTENT 🔗

DAX Lib
Jake's LinkedIn

Posted on May 4, 2026 and filed under Livestreams, DAX.

Master DAX Foundations in Power BI: Calculations, Data Models & Filter Flow (Part 1)

Video by: Reid Havens

Start thinking in DAX instead of Excel. This interactive guide walks through everything you need to build a mental model for Power BI calculations: what DAX actually is, how measures differ from calculated columns, table and column references, star schema basics, and how filters flow from dimension to fact tables. Part 1 of a 3 part DAX Fundamentals series.

Topics covered:

  • Excel formulas vs DAX: what changes and why

  • Measures vs calculated columns: when to use each

  • DAX syntax: table references, column references, and measure calls

  • Star schema: fact tables, dimension tables, and relationships

  • Filter flow: how slicers and relationships shape your results

RELATED CONTENT 🔗

DAX Foundations (Part 1)
Analytic Endeavors

Posted on April 21, 2026 and filed under DAX.

Power BI Report-Scoped Measures: 6 Patterns for Better Reports

Video by: Reid Havens

Report-scoped measures (aka report-specific measures) are one of the easiest ways to level up a Power BI report without turning your semantic model into a junk drawer.

In this video, I walk through my Visual & Report-Scoped Measures guide and show the art of the possible. No deep DAX theory, no data engineering detours, just practical patterns you can steal immediately.

We’ll cover:

  • What “report-scoped” measures are (and when you should use them)

  • Six practical patterns for enhancing report UX with measures

  • Dynamic titles that respond to context

  • Conditional formatting driven by measures (so visuals explain themselves)

  • How to keep your model clean while still making reports more interactive and readable

If you build reports for humans (not just for your own amusement), this is a strong set of patterns to have in your toolkit.

Power BI Field Parameters vs Calculation Groups (Clear Comparison)

Video by: Reid Havens

In this video I walk through the Field Parameters vs Calculation Groups Guide from Analytic Endeavors and explain what these two powerful Power BI features actually do, how they differ, and when to use each one in your reports.

You’ll learn:

  • What Field Parameters are and how they let your users choose what to show in visuals

  • What Calculation Groups are and how they let you change how measures calculate dynamically

  • The key decision points between using FP and CG

  • How each feature affects report design, maintenance, and flexibility

This is a conceptual walkthrough, not a step-by-step build. The goal is to help you understand the behaviors and tradeoffs so you can pick the right tool for the problem you’re solving.