Posts filed under DAX

P3: Using Conditional Formatting With Text in Power BI Desktop

Hello P3 Nation! Today's "post" is actually going to be a video link. Sometimes there are certain subjects, concepts, or post ideas that just don't translate well to the written word, and especially to screenshots. So this post will be in moving picture form!

Video by: Reid Havens

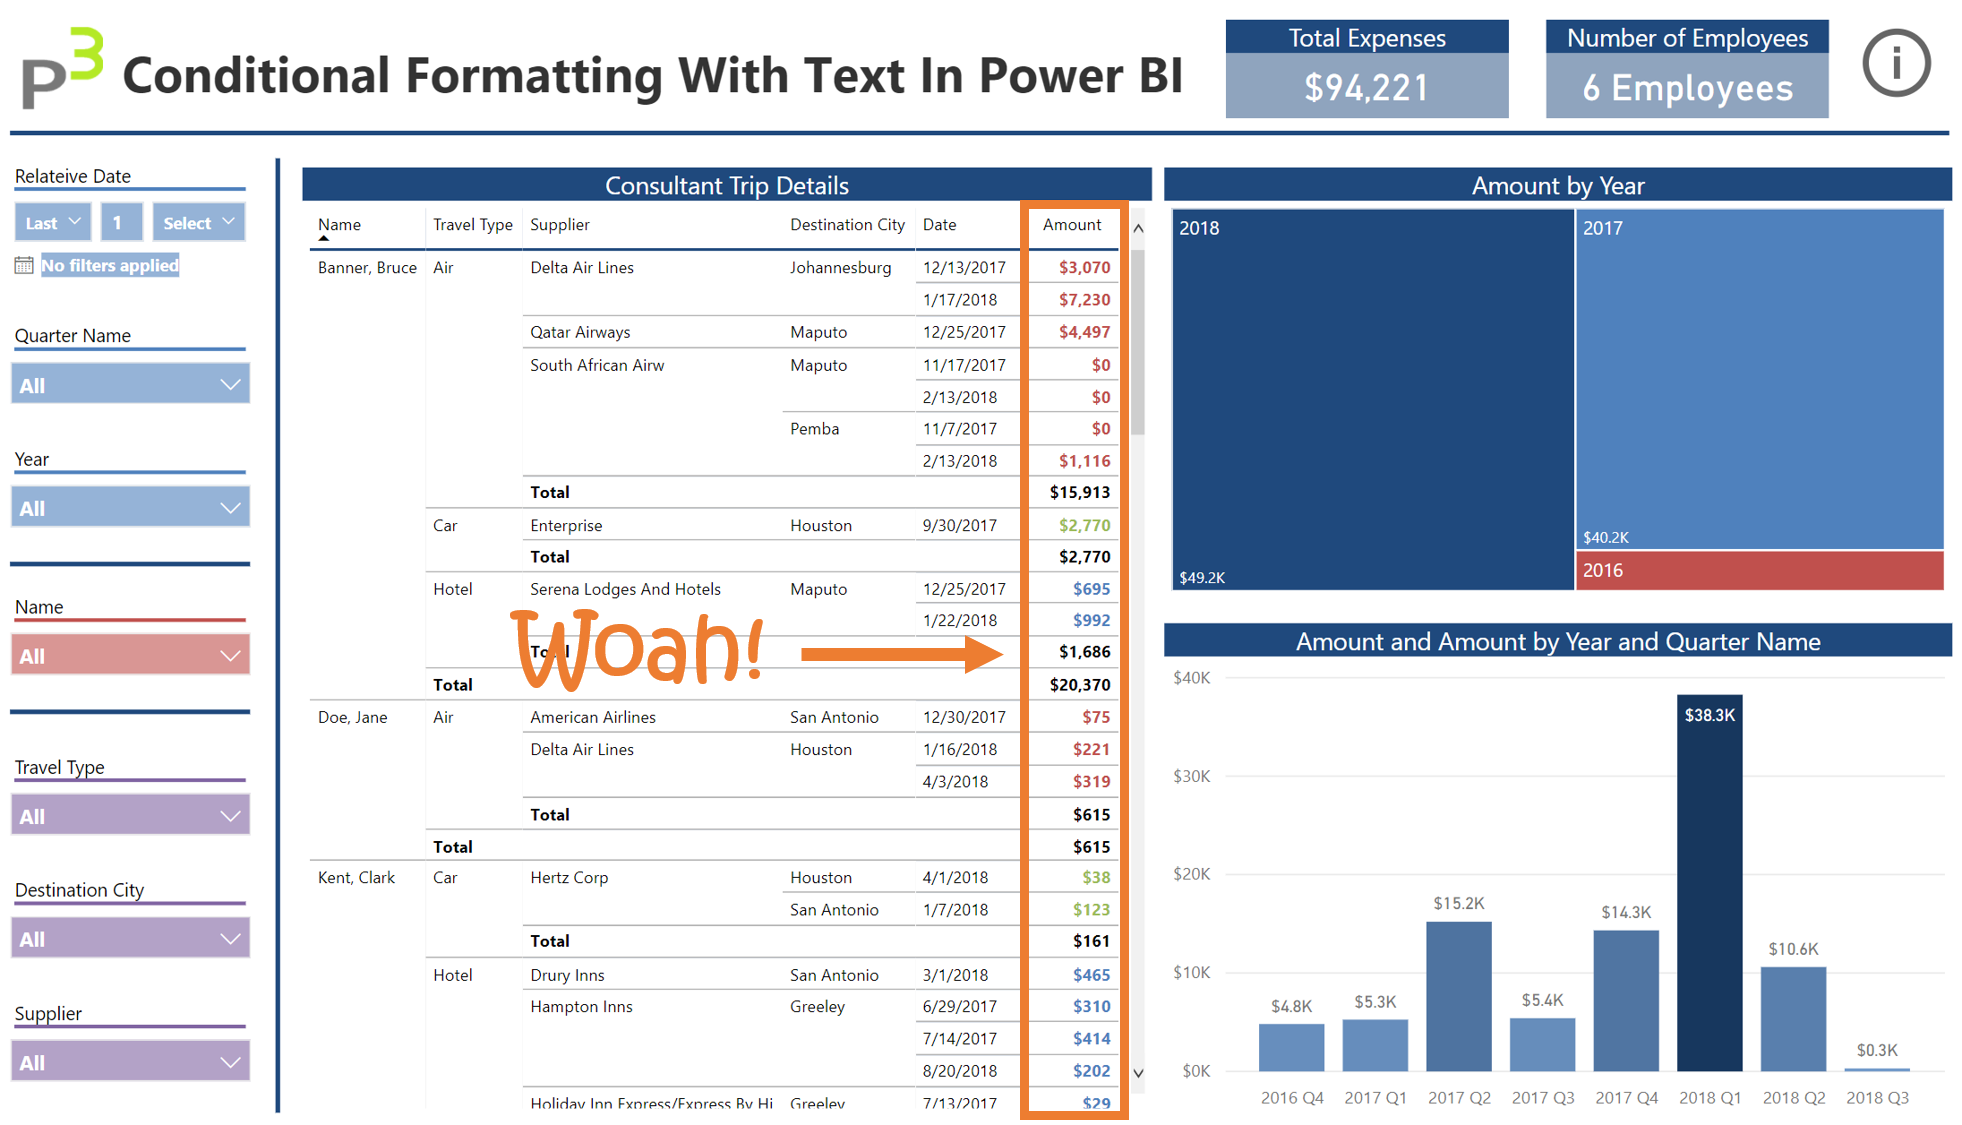
Today’s topic covers how to apply Conditional Formatting using text in Power BI Desktop. Conditional Formatting recently got a feature update, that allows you to apply color formatting rules based on ANY DAX Measure. I recently encountered a business scenario that had me play around with this feature a bit, and I came up with a clever way to use this for a client. I’ve included below the embedded Power BI report, download link to the .pbix file, and links to other articles explaining the various features & design techniques I’ve applied in this report. Otherwise, enjoy the video!

P3: Disconnected Slicers With DAX Variables And SELECTEDVALUES

Today's topic covers how to create a Disconnected Slicer using DAX Variables and SELECTEDVALUES. We've easily written a few dozen articles over the years on ways to use disconnected slicers, and here's another one! The great thing about DAX is that as it EVOLVES, writing measures and utilizing certain features becomes easier.

Article by: Reid Havens

Today’s topic covers how to create a Disconnected Slicer using DAX Variables and SELECTEDVALUES. We’ve easily written a few dozen articles over the years on ways to use disconnected slicers, and here’s another one!

The great thing about DAX is that as it EVOLVES, writing measures and utilizing certain features becomes easier. That’s the goal of this video, it’s not re-inventing the wheel, just refining it. I’ve included below the original DAX Formula I used in the walkthrough. Otherwise, enjoy the video!

P3: Using SELECTEDVALUES To Capture Power BI Slicer Selections

Article by: Reid Havens

Data Ambiguity…The Silent Report Killer

Hello P3 Nation, I’m excited to be back and writing a technical post again…it’s been too LONG! Today I want to talk to you about a real-world business problem and solution I encountered last year. I think it’s a scenario at least a few of you will relate to. I was working on a project for a client, and needed to create a Power BI report for them.

Posted on February 1, 2018 and filed under Intermediate, Power BI, DAX, PowerPivotPro.

P3: DAX Reanimator Series: Top Performers using SUMMARIZE

Article by: Reid Havens

Welcome back P3 nation, today I’d like to demonstrate some exciting ways to show Top Performing “things” using DAX. Most of what we’ll discuss has been covered before in previous posts written here at PowerPivotPro. Rob has extensively covered the topic of Top Performing “things” in not one, not two, but THREE previous posts! So today I want to start us off by reviewing these awesome techniques, and taking a look at how to some of those practices can be used in a Power BI report.

Posted on September 28, 2017 and filed under Power BI, DAX, Intermediate, PowerPivotPro.