
Posts tagged #External Tools

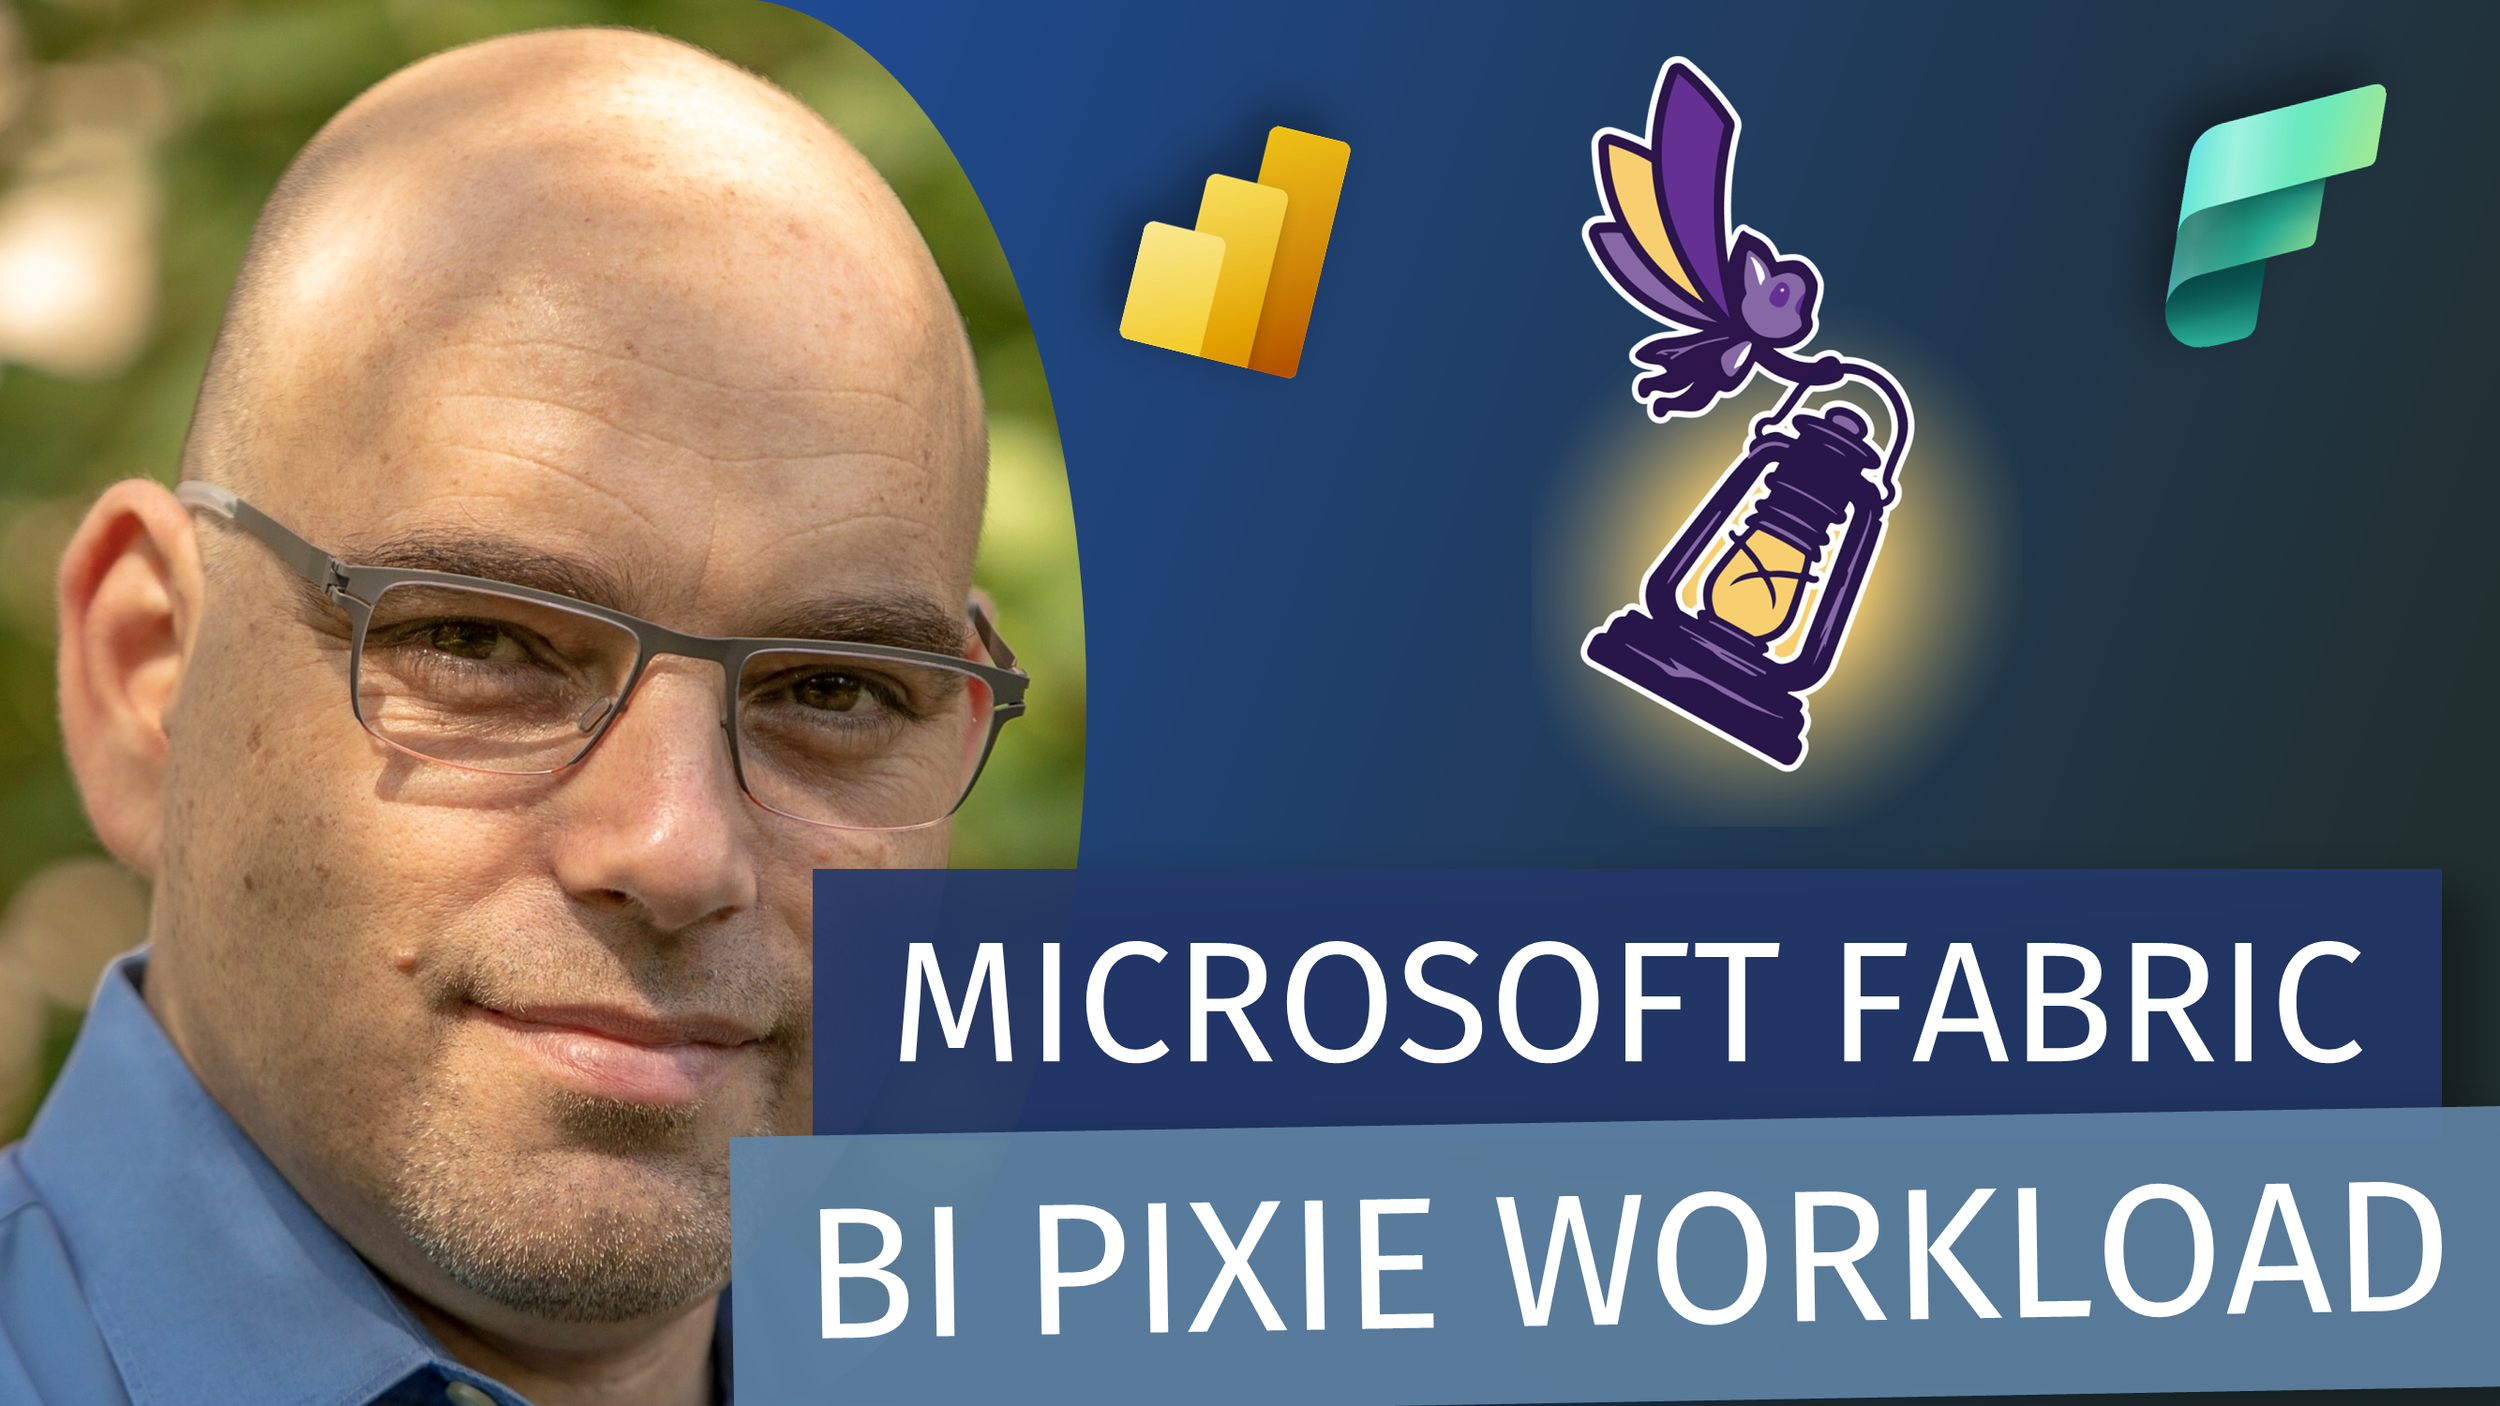
BI Pixie Workload on Fabric: From Power BI Usage to AI Readiness - w/ Gil Raviv

LIVESTREAM DATE/TIME 📅

August 7th 2026 - 9:30 (Pacific Time)

DESCRIPTION 📄

Power BI tells you how many times a report was opened, but not whether people actually understood it, trusted it, or found what they needed. BI Pixie is a usage analytics and AI readiness solution for Power BI, now available as a native Microsoft Fabric workload.

In this session, we'll demo the latest BI Pixie features and take you on a journey from Power BI usage to AI readiness. We'll start by showing how BI Pixie captures what really happens inside your reports, with visual-level heatmaps, click and filter tracking, and in-report satisfaction signals that reveal which content drives value and which quietly gets ignored.

Then we'll move up the stack to the part everyone is asking about: getting your data ready for AI. You'll see how BI Pixie assesses whether your semantic models are ready for AI agents like Copilot, Fabric data agents, and MCP with an engagement-weighted Readiness Score; how it optimizes those models with targeted improvements; and how you can create benchmarks to verify the effectiveness of your data agents and semantic models over time.

If you own Power BI adoption and you're wondering how to prepare your estate for AI, this one is for you.

GUEST BIO (Gil Raviv) 👤

Gil Raviv is the founder of BI Pixie and DataChant Consulting, and a Microsoft MVP. Gil has led global BI practices at Avanade/Accenture and AWS and today focuses on helping enterprises measure and improve the adoption, trust, and governance of their Power BI reports through BI Pixie.

RELATED CONTENT 🔗

BI Pixie
Gil's LinkedIn

Posted on July 28, 2026 and filed under Livestreams, Fabric.

Sneak Peek: New PBI Multi-Tool Cleanup Features! Themes, Visuals & Bookmark Removal

Video by: Reid Havens

Get an exclusive first look at the upcoming Power BI Multi-Tool cleanup features!

🧹 This update makes report maintenance easier than ever by automatically removing unused:

  • Themes

  • Visuals

  • Bookmarks

Streamline your PBIP files, reduce clutter, and keep your Power BI projects running smoothly. Perfect for anyone looking to optimize and organize their reports with just a few clicks.

RELATED CONTENT 🔗

Analytic Endeavors Power BI Multi-Tool

Posted on August 12, 2025 and filed under External Tools, Tools & Software, Reporting.

(Livestream Replay) Introducing Fabric Workloads & PowerTable for Fabric Data Apps w/ Live Writeback - with Gopal

DESCRIPTION 📄

PowerTable by Lumel is a Fabric workload that enables business users to build no-code, write-back-enabled table applications directly on Microsoft Fabric. It connects live, with full bi-directional sync, to your cloud data warehouse tables including Fabric SQL, Fabric Data Warehouse, Azure SQL, Snowflake, Databricks, and other major data platforms.

PowerTable also integrates seamlessly with your Power BI semantic models, supporting no-code write-back scenarios that are distinct from Translytical Task Flows, which are designed for pro-code use cases.

In this session, you’ll also learn how PowerTable is fundamentally different from traditional table app solutions like Airtable, SmartSheet, or Microsoft Access, offering a fully governed, enterprise-grade approach designed for the Microsoft Fabric ecosystem.

PowerTable by Lumel is a Fabric Workload that allows business users to build no-code, writeback-enabled table apps on Microsoft Fabric. It connects live (with bi-directional sync) to your cloud data warehouse tables in platforms such as Fabric SQL, Fabric Data Warehouse, Microsoft Azure SQL, Snowflake, Databricks and other major data platforms. 

GUEST BIO 👤

Gopal Krishnamurthy is the Founder and CEO of Lumel. He is a visionary who saw the rise of cloud data platforms and adopted very early on (Snowflake, Databricks, DBT) with Visual BI and successfully divested and exited the consulting business (Visual BI) with the sale to Atos in 2021. When he also saw the BI market consolidating with Power BI, he positioned Lumel to become the #1 Microsoft Fabric and Power BI AppSource Partner. He also predicted the rise of native apps on top of data platforms as organizations look to eliminate data silos as a prerequisite to make their data AI-ready. So, he doubled down on his vision of building an integrated Lumel native app that consolidates planning, master data, reporting, and analytics on top of semantic models and envisions Lumel as the new “Face of Data” for everyday application needs.

RELATED CONTENT 🔗

Lumel
Power Table
Gopal's LinkedIn
Lumel's LinkedIn

Posted on July 3, 2025 and filed under Livestreams, Fabric, Governance, Writeback.

(Livestream Replay) Auto-magically Checking For Broken Visuals in Power BI - with John Kerski

DESCRIPTION 📄

A.K.A - Avoiding the "Grey Box of Death!"

Have you ever updated a semantic model/dataset and didn't realize it broke a visual in a Power BI report? Have you ever seen that "grey box of death" (or your customers call you about it) after making an update to Power BI? In this session, I demonstrate a way to combine Microsoft Playwright and Azure DevOps to automatically test for broken visuals and notify you about those issues.

GUEST BIO 👤

John leverages his 10+ years of technical and government leadership experience to help Federal Agencies, and private sector clients utilize Microsoft products to their fullest potential. His certifications with Microsoft products offers customers a high rate of return when looking to invest in Microsoft solutions.

RELATED CONTENT 🔗

Blog
LinkedIn
Test for Broken Visuals
Automate with DevOps

Posted on January 24, 2025 and filed under Livestreams, Visualizations, Azure.