
Posts filed under Power BI

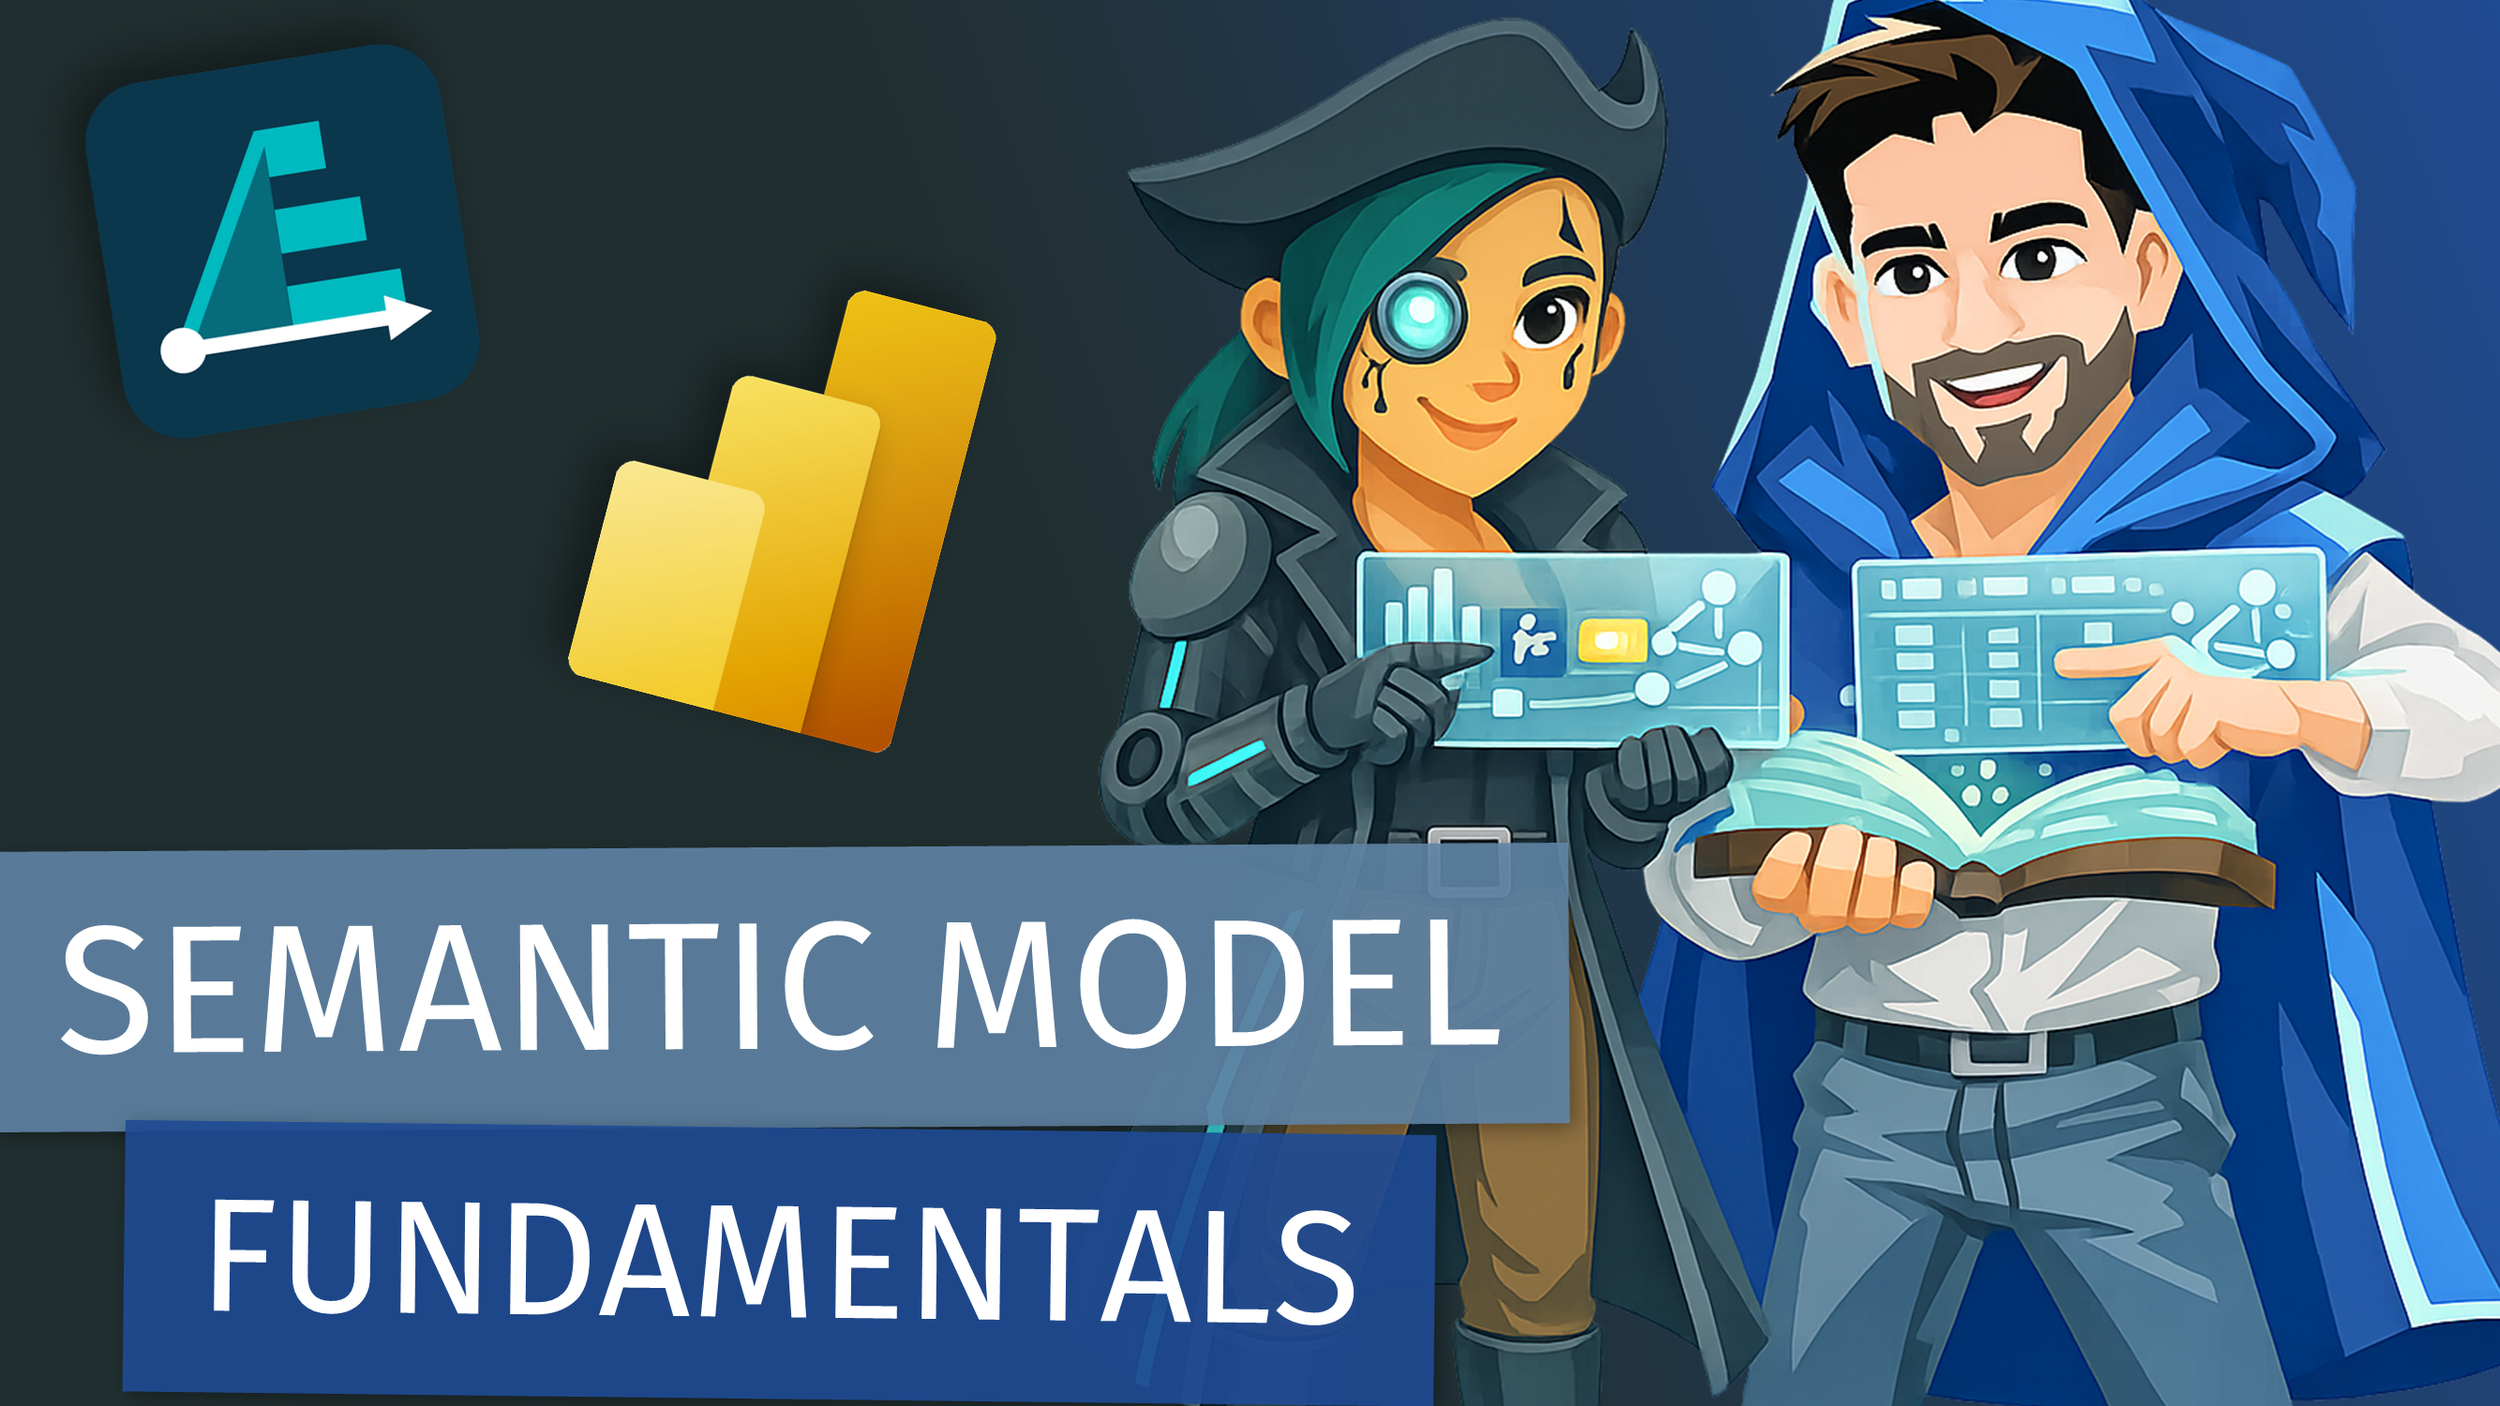
Model Your Data in Power BI: Star Schemas, Filter Flow & Field Lists

Video by: Reid Havens

Plenty of Power BI issues that look like DAX issues start one layer down, in the model. The formula is correct, the relationship underneath it isn't doing what you assumed, and you spend an afternoon rewriting a measure that was never the problem.

This one covers the foundation the rest of it sits on. Why a model beats one giant flat table (smaller storage, better compression, faster refresh, and filter paths you get without writing any code), how dimensions and facts split the who-what-when-where from the numeric events, and what actually happens when someone picks a value in a slicer and that filter travels down the relationship into the fact table.

Then star versus snowflake, compared on the four things that decide it in practice: query performance, DirectQuery latency, how long the DAX ends up, and whether business users can find a field without asking someone. Star wins on all four. I also get into why the snowflake version keeps turning up anyway, since it usually arrives from a source system rather than from a decision anyone made.

The last section is the one that gets skipped. Every visual in Power BI generates a query with three ingredients (filter, group, summarize), and once that clicks, a wrong number stops being mysterious. After that it's the fields list itself: friendly names instead of cgo_key_fk, display folders, hidden keys, and descriptions that surface as tooltips. It sounds cosmetic, but an unreadable fields list is how you end up with six competing Excel copies of the same report.

Building to Teach: AI-Assisted Tools for Data Viz Education (w/ Ben Ferry)

LIVESTREAM DATE/TIME 📅

September 4th, 2026 - 9:30 AM (Pacific Time)

DESCRIPTION 📄

What if you could use your own expertise and AI to build a tool that didn't exist yet? Ben did exactly that.

He built Ferry Tales Studio, a browser-based Vega-Lite chart editor for Power BI and Deneb users, using Claude Code to design, iterate, and ship something genuinely useful. In this live demo, Ben walks through the tool and explains why he built it: to give people a hands-on way to learn data visualisation by doing.

The takeaway: you don't need to be a software engineer to build tools that teach.

GUEST BIO (Ben Ferry) 👤

Ben Ferry is a Senior Analytics Consultant at Solita Germany with a passion for data visualisation and making it more accessible. Through Power BI Ferry Tales, he creates content and tools to help the data community grow. Ferry Tales Studio, built with Claude Code, is his latest example of how practitioners can use AI to ship real, useful products without a traditional engineering background.

RELATED CONTENT 🔗

Power BI Ferry Tales
Ben Ferry LinkedIn
Ben on Bluesky

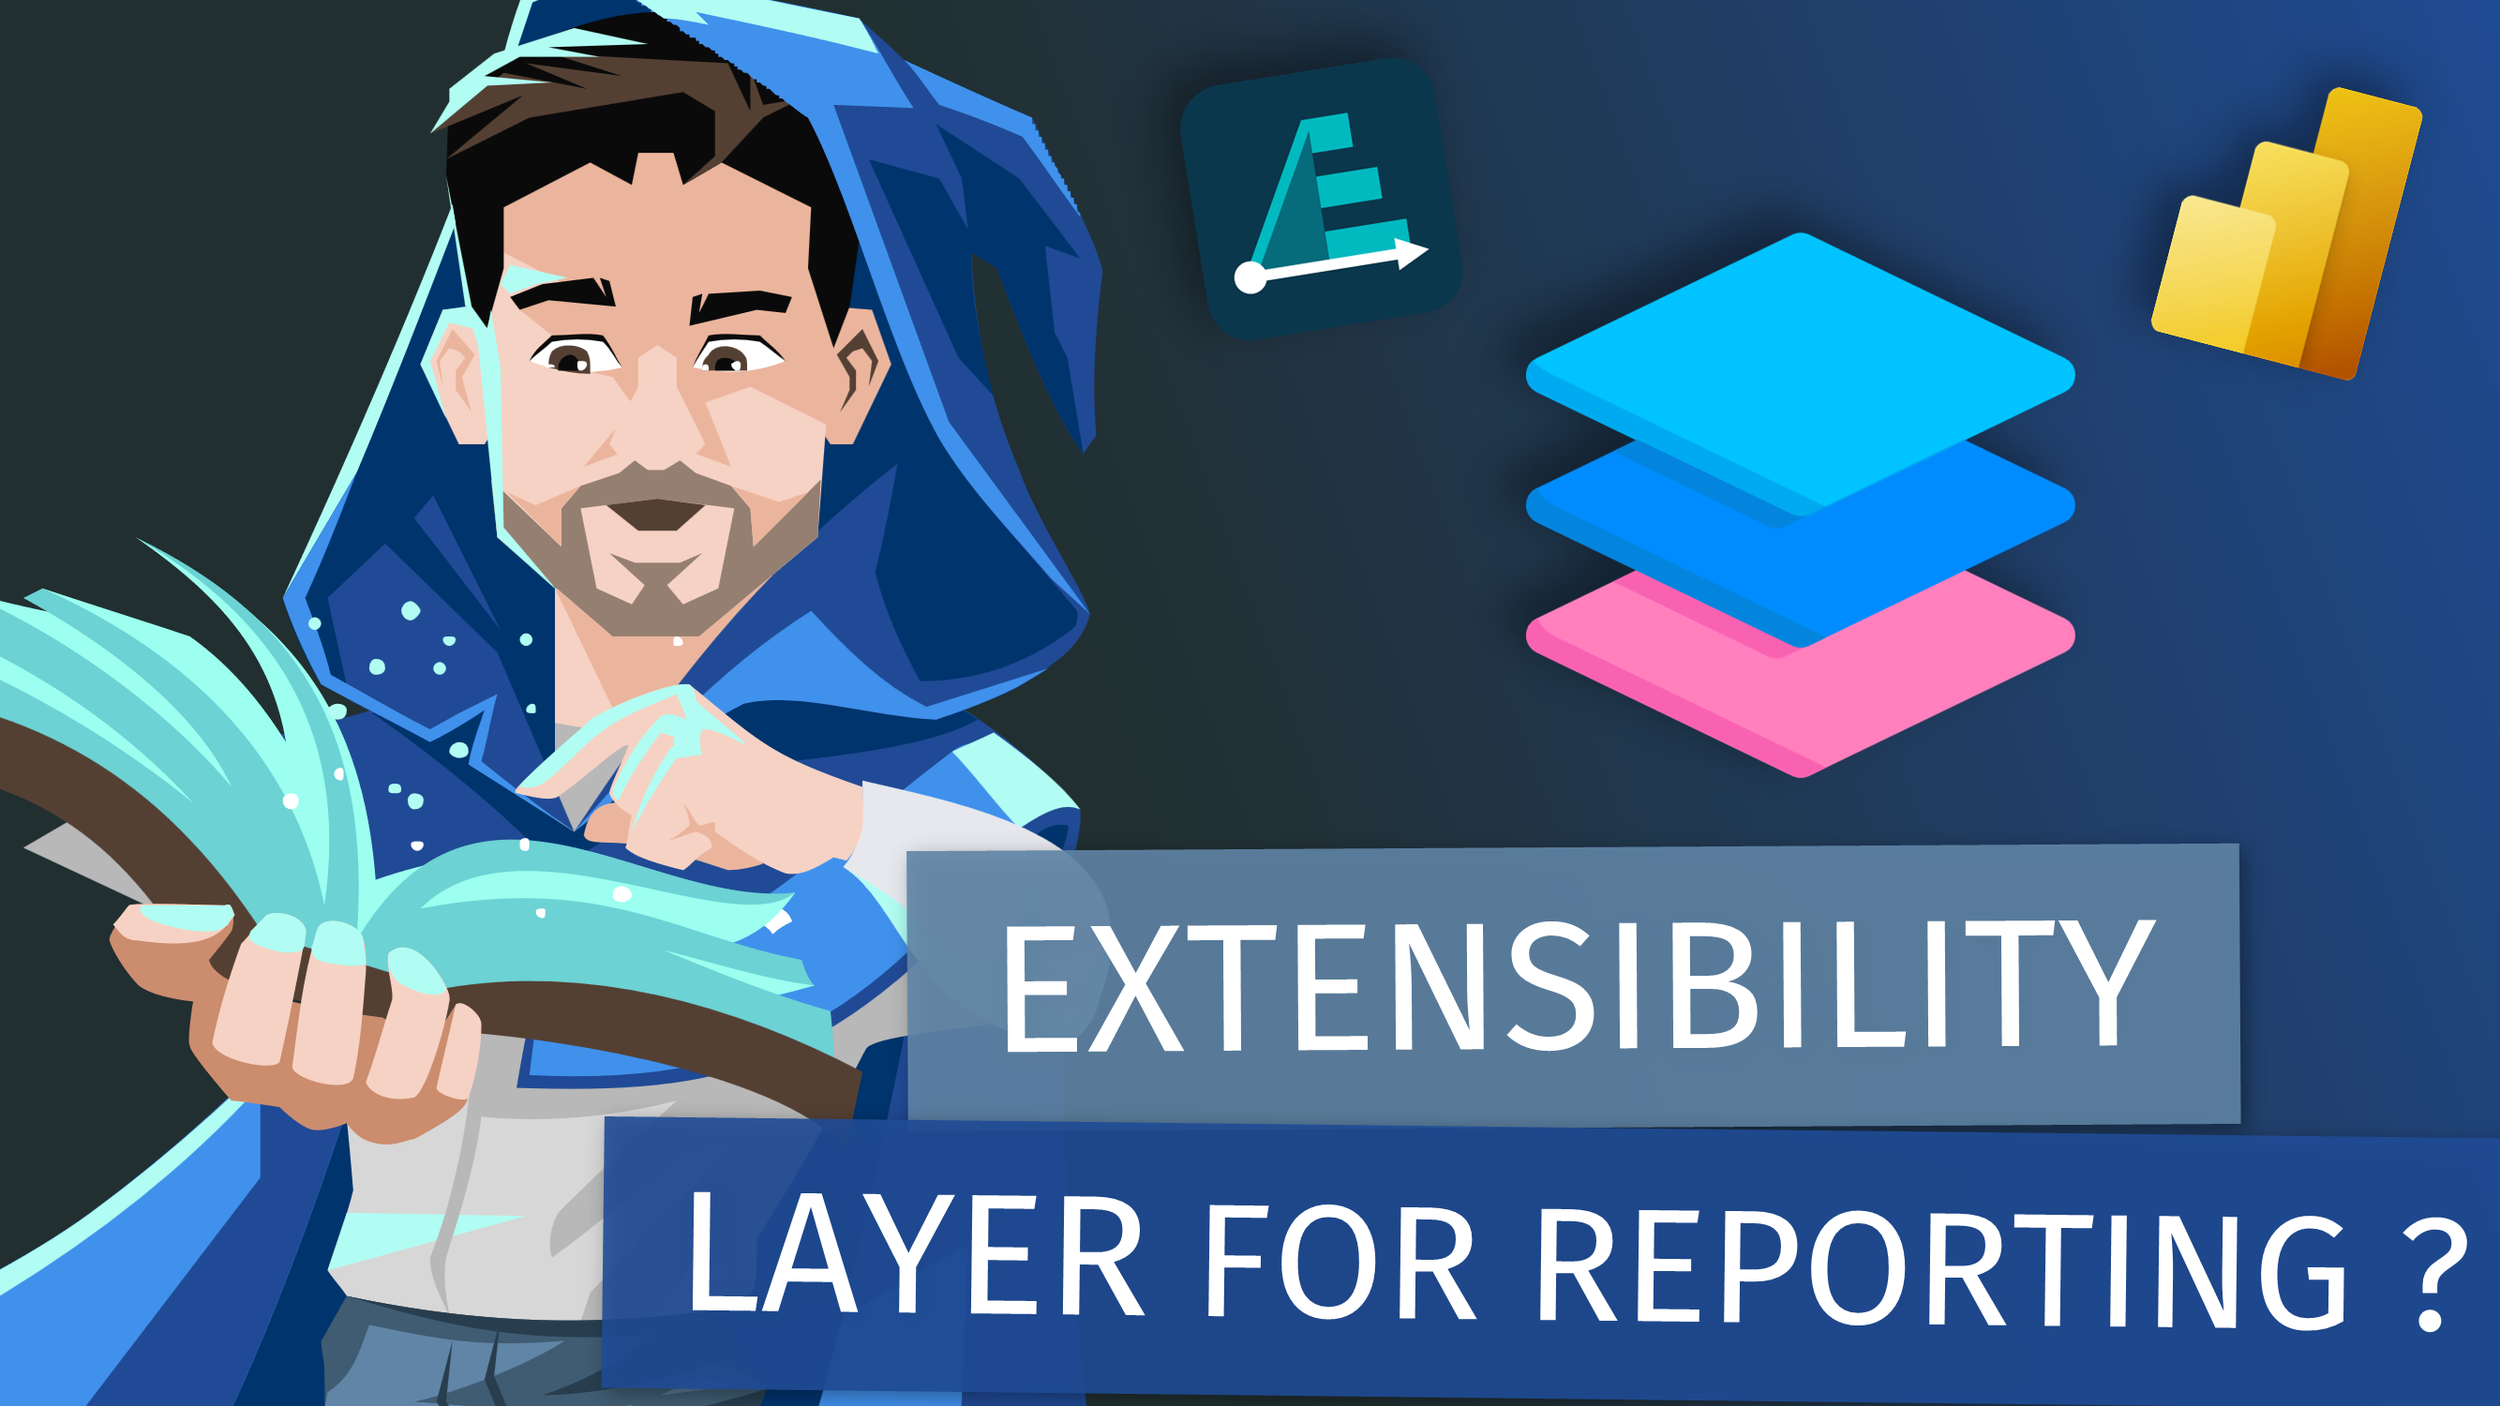
Your Core Model Isn't Supposed to Do Everything | Power BI Extensibility Layer Objects

Video by: Reid Havens

Here's something that trips up a lot of Power BI developers: not everything belongs in your core semantic model. Some objects are meant to live in a departmental layer. Some belong in a single report, knowing the difference changes how you build, and how well your architecture holds up over time.

In this video I walk through Power BI's extensibility layer objects: what they are, where each one belongs in your architecture, and when to actually use them.

RELATED CONTENT 🔗

Full Guide | Analytic Endeavors

AI-Powered Power BI: Building Custom Themes & Visuals with GitHub Copilot - with Zoe Douglas

LIVESTREAM DATE/TIME 📅

February 20th, 2026 - 9:30 AM (Pacific Time)

DESCRIPTION 📄

GitHub Copilot can turn Power BI customization from a tedious, manual grind into a fast, interactive workflow. In this session, you’ll see how to generate polished report themes by extracting color palettes from images, create named style presets that show up directly in Power BI’s formatting pane, and build custom visuals from scratch with Copilot as your pair programmer. From JSON theme schemas to visual implementation details, you’ll leave with practical techniques to speed up development, improve consistency, and ship better-looking reports with less trial-and-error.

GUEST BIO (Zoe Douglas)👤

I'm a product manager for Power BI working on core visuals with focus on the default and theming experience with visuals in reports. I'm also good with a semantic model and worked on features such as DAX query view, Copilot to write DAX queries, Copilot to write measure descriptions, Optimize ribbon, and more! Before coming to Power BI product group I was a Power BI consultant using Power BI everyday to bring insights to action!

RELATED CONTENT 🔗

LinkedIn
Zoe's Blog
Zoe's GitHub

Posted on February 11, 2026 and filed under Livestreams, AI, Copilot, Power BI.